Forgive me, everyone, for I have been a bad blogger and have not written in quite some time.
Despite what many think, we actually have been busy. Besides joining forces with another company to nearly double our size, we have also been navigating an odd market to start this year.
But before you try to turn ‘odd market’ into ‘down market,’ don’t. The market isn’t down.
And that is what this post is about.
But First, an Anniversary
A few days ago, I had a photo in my timeline that showed a screenshot from 2013 that was on one of our sites –– which means the blogs we have been writing go back a DECADE.
I don’t think I realized that we had been filling up this blog for that long, but I noticed it actually went back to 2011!
< Self-high five! >
A Decade Later, It’s Still Inventory
While a decade (ok, 12 years) of blogs and $4 gets you a coffee these days, it does have some value over and above just a bunch of words on some server –– it documents what you were thinking / saying / recommending / telling people through a lot of different markets.
You can see what you got wrong and what you got right, as well as what you thought mattered over the period you wrote.
This is a long winded way of saying, if you go back and look for a common theme in our blogging, it would be that the single most important predictor of the market is one thing – inventory.
How Do You Calculate Inventory?

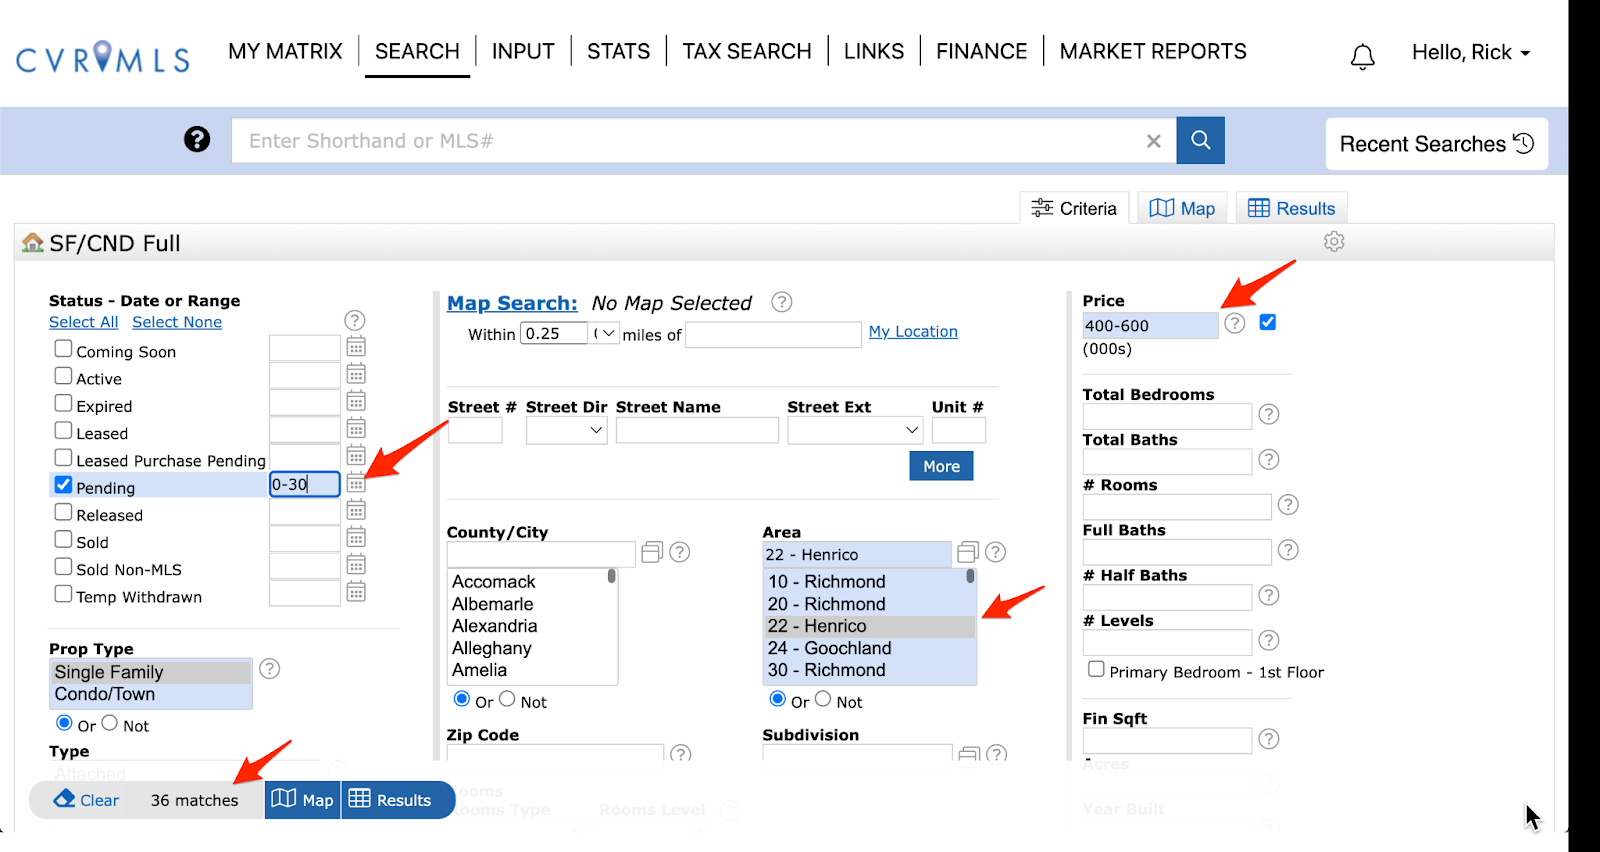
As a reminder, when we say inventory, we are referring to how long it would take to sell the houses that are currently on the market, provided no one new listed their home for sale.
Specifically, you calculate inventory in ‘months’ by looking at the number of homes available (ACTIVE) over the number of homes absorbed in the past 30 days (PENDING) and determining the ratio.
1000 homes available and 500 sold in the last 30 days = 2 months of inventory.
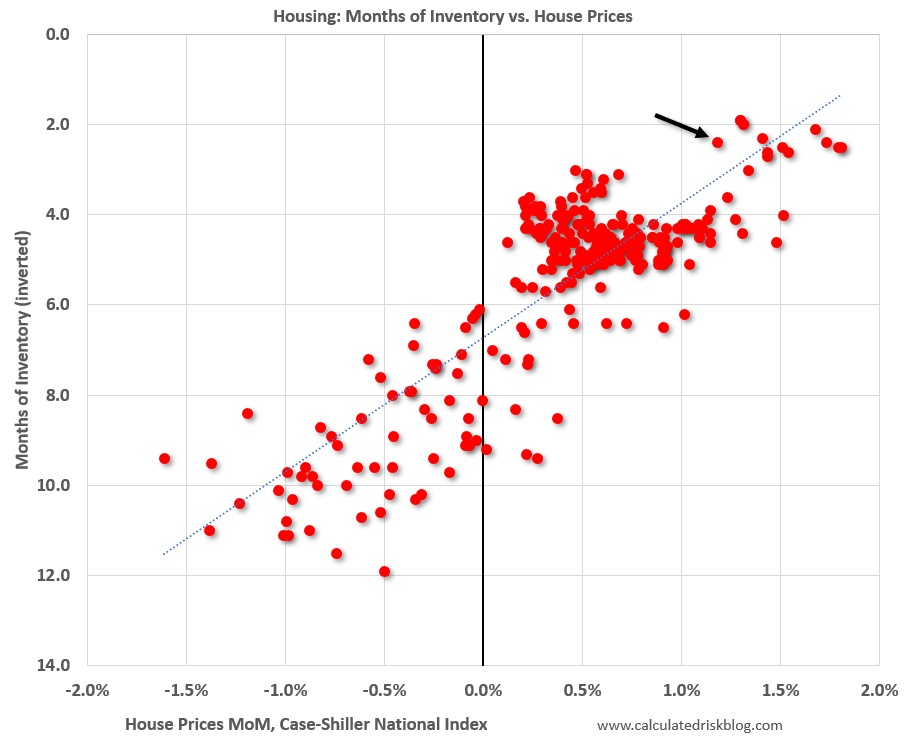
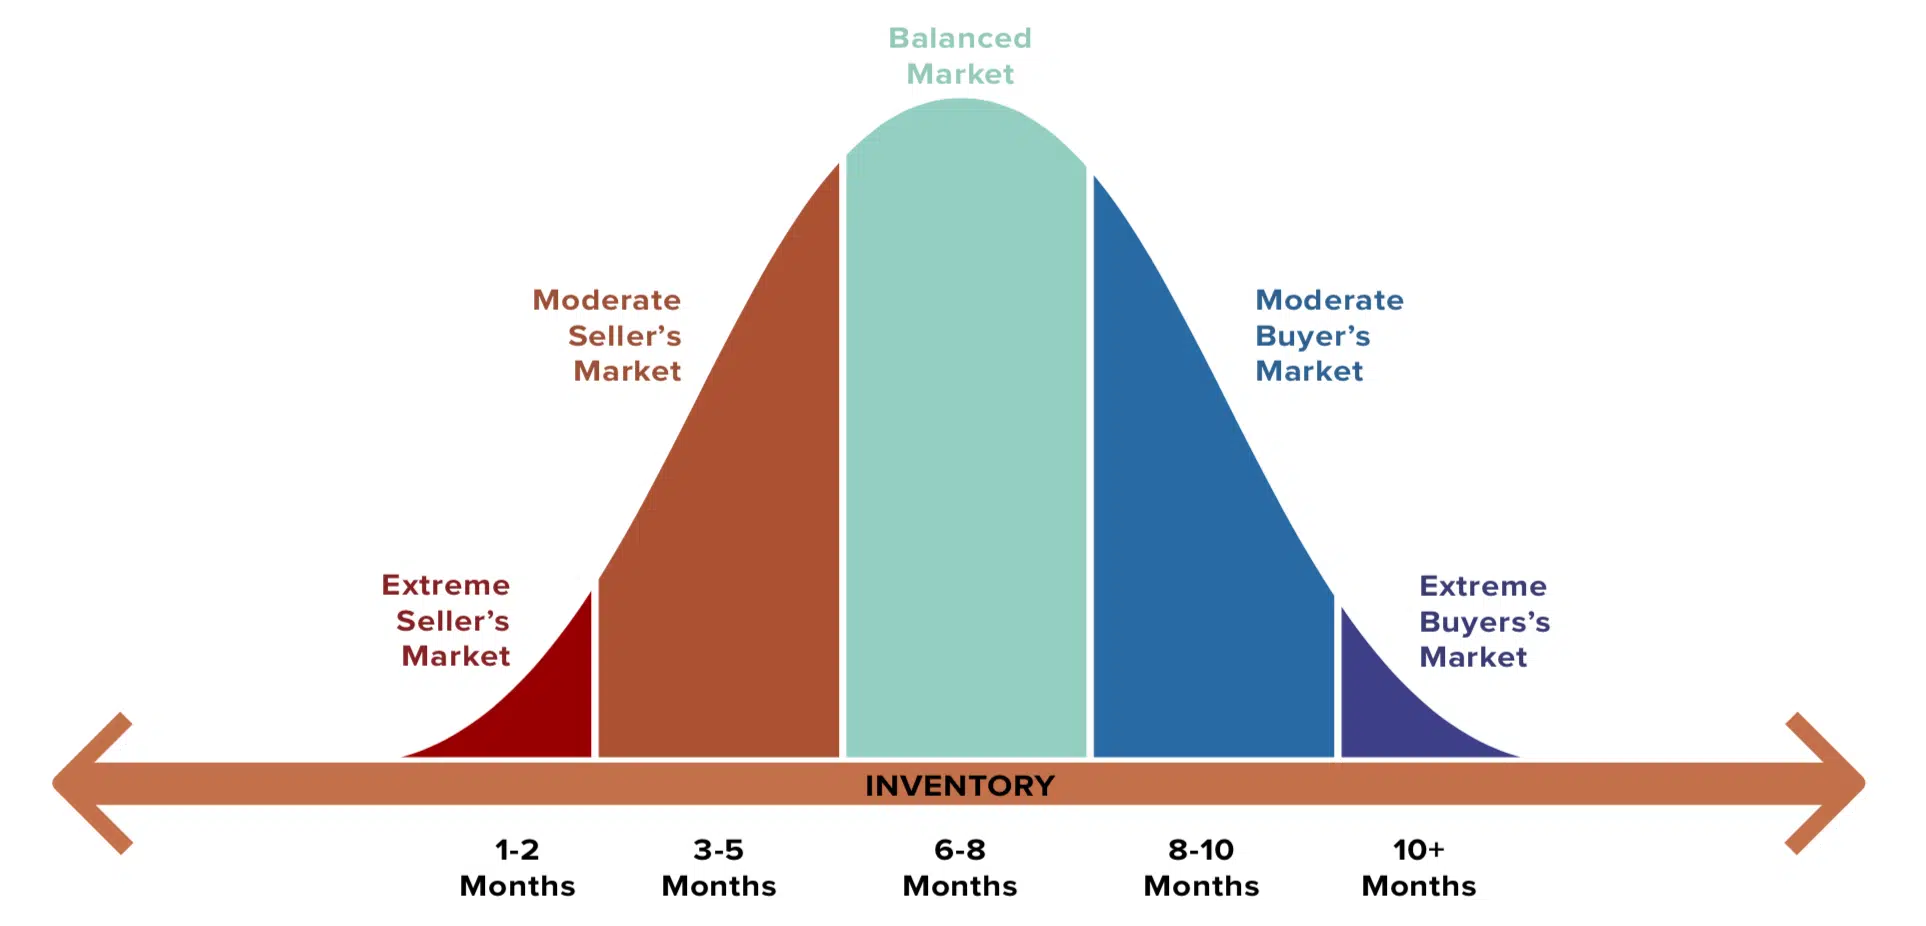
Why does it matter? Because it predicts house price appreciation quite accurately:
- If inventory is less than 6 months, prices rise – and the lower the inventory is, the faster prices rise.
- If inventory is more than 10 months, prices fall – and the higher the inventory is, the faster they decline.
- Between 6 and 10 months, prices kinda bounce around a bit and don’t really move that much.
Just so you realize, this isn’t my observation, it is Robert Shiller’s observation, who has a Nobel Prize in economics. I just happen to strongly agree with him.
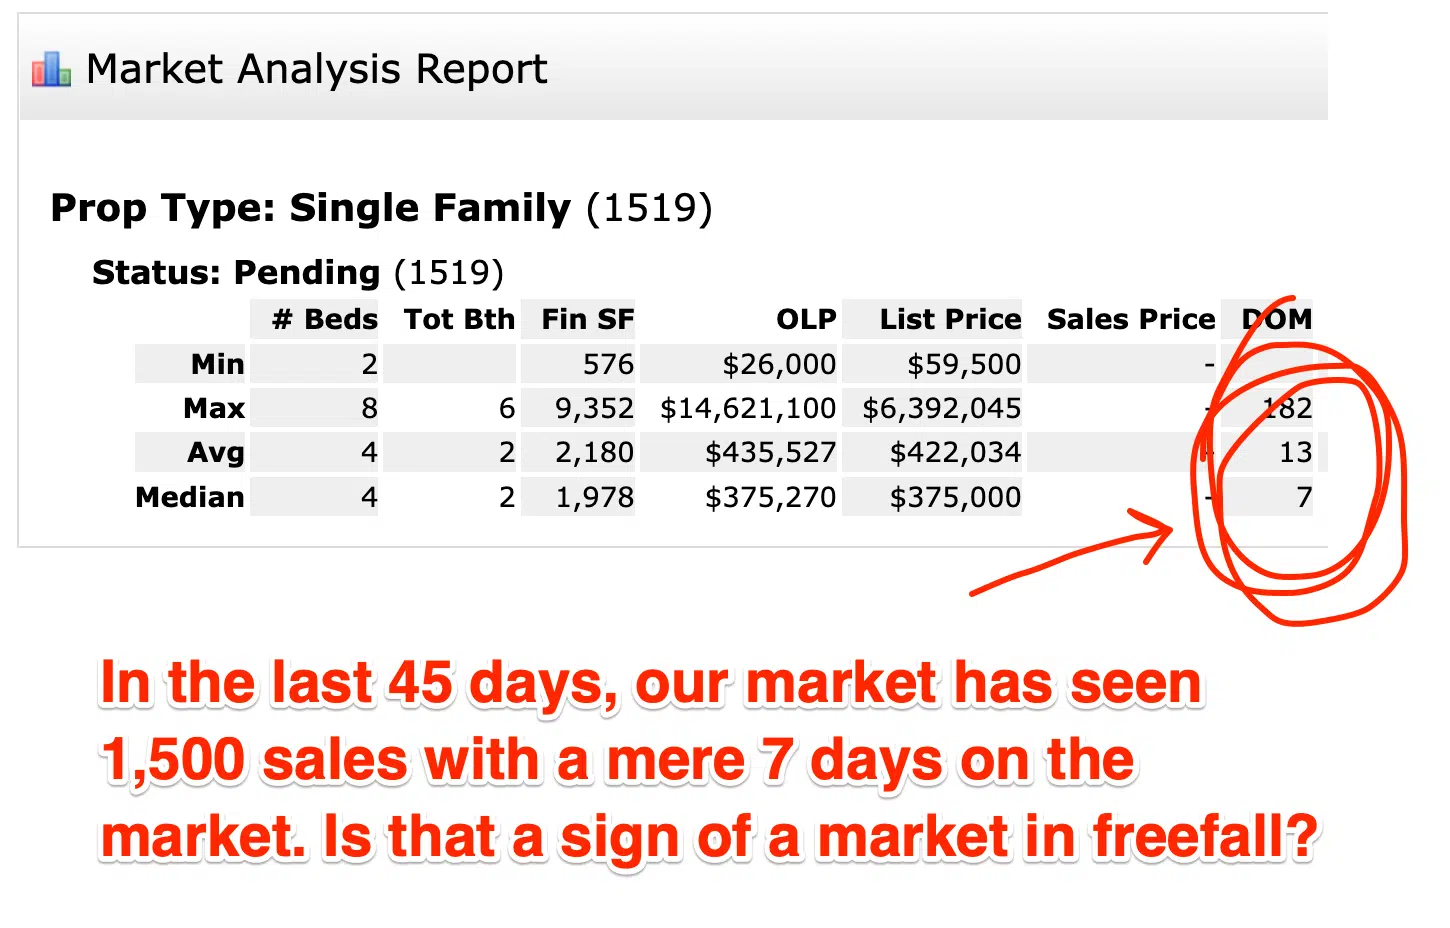
Where is RVA’s Inventory?
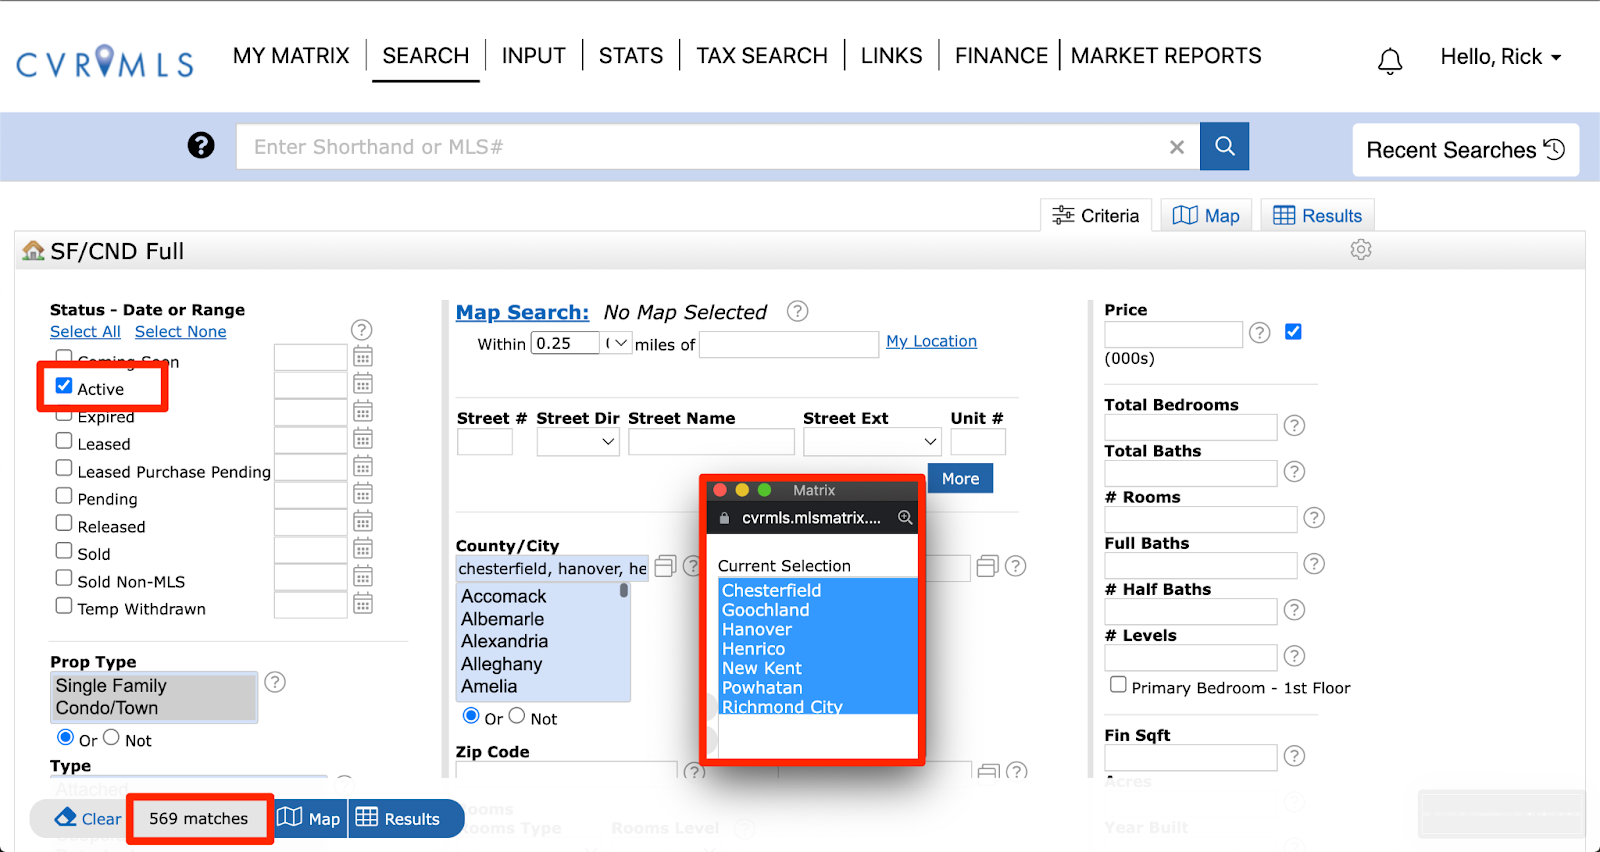
As I write this blog, there is less than 1 month of resale homes on the market, and about 2.5 months of new homes.
Collectively, we have about 1.2 months of total inventory available in the RVA Metro region.

That is looooooow.
When inventory is less than 2 months, look for price appreciation approaching double digits.
Yes, I just said that.
Now it doesn’t mean that all price points and all areas will go up by double digits (you need to look to your specific sub-market) but some will for sure. Especially the less expensive and closer in.
But, Rick, What About the Rates?!?
Yeah, what about ‘em?
I know, they went up. Went up by 2X in less than 6 months –– an unprecedented and historic increase.
It is a big deal for sure, but not in the way that you think.
This may come as news to some, but rates don’t determine whether or not a buyer qualifies, rates determine how much a buyer qualifies FOR.
It is a subtle –– but critical –– point to understand about the housing market that a lot of so-called experts tend to forget.
What allows you to qualify for a mortgage? Good credit and stable employment. That’s it.
Rates impact HOW MUCH you can buy, not IF you can buy.
The rate is the variable that determines how much house you qualify for. When rates rise people don’t somehow magically not qualify for a mortgage, they just qualify for a smaller one.
RVA and Migration
Do you know the median sales price in Richmond? It is roughly $350,000.
Do you know the median sales price in the northeast (from PA to Maine)? $700,000 (and their real estate taxes are 2-3x as well.)
So, if you are a 35 year old, living in Bethesda MD ($1M) or Haddonfield NJ ($600K) or Lorton VA ($580K), what do you do, especially now that you get to work from home?
You move to a cheaper market.

Notice a trend?
And what is the first city you reach when you leave DC on 95 that actually has a skyline?
Richmond.
What is the next one? Jacksonville, FLA (in other words, a lot of farmland between here and there.)
The inbound migration to Richmond is at all time highs – and positive inbound migration provides a lot of tailwinds (i.e. –– pressure on house prices.)
Between our (relatively) cheap housing and proximity to DC (by car) and NY (by plane), along with a very stable economy underpinned by government, education, healthcare, and a shocking number of Fortune 500 companies, we are finally an overnight success after about 50 years.
And our house prices back that narrative.
Don’t Let the News Fool You
We spend far more time paying attention to bad news than good news, and everyone who is paid by clicks knows that.

And thus the scare tactics.
Don’t fall for it.
Our market is fine – and as a matter of fact, little ol’ RVA actually led the nation in appreciation last fall and it is continuing to thrive as other markets adjust (from the article – “Appreciation was still high in Florida, led by Miami with 12.8% growth, and Jacksonville, with 9.3% growth. Other top markets where home prices are still climbing include Hartford, Conn., Richmond, Va., and Orlando, Fla.”)
Summary
The bottom line is that RVA is not the USA.
What is happening in San Fran, NYC or Vegas is not happening here. Real estate is and will always be a local endeavor, and when you apply a blanket statement to the entire nation, you aren’t going to get it right.
Yes, maybe some of our upper price points are a bit softer, and new construction still has some adjusting to do, but trust me when I say this, WE ARE MORE THAN FINE.
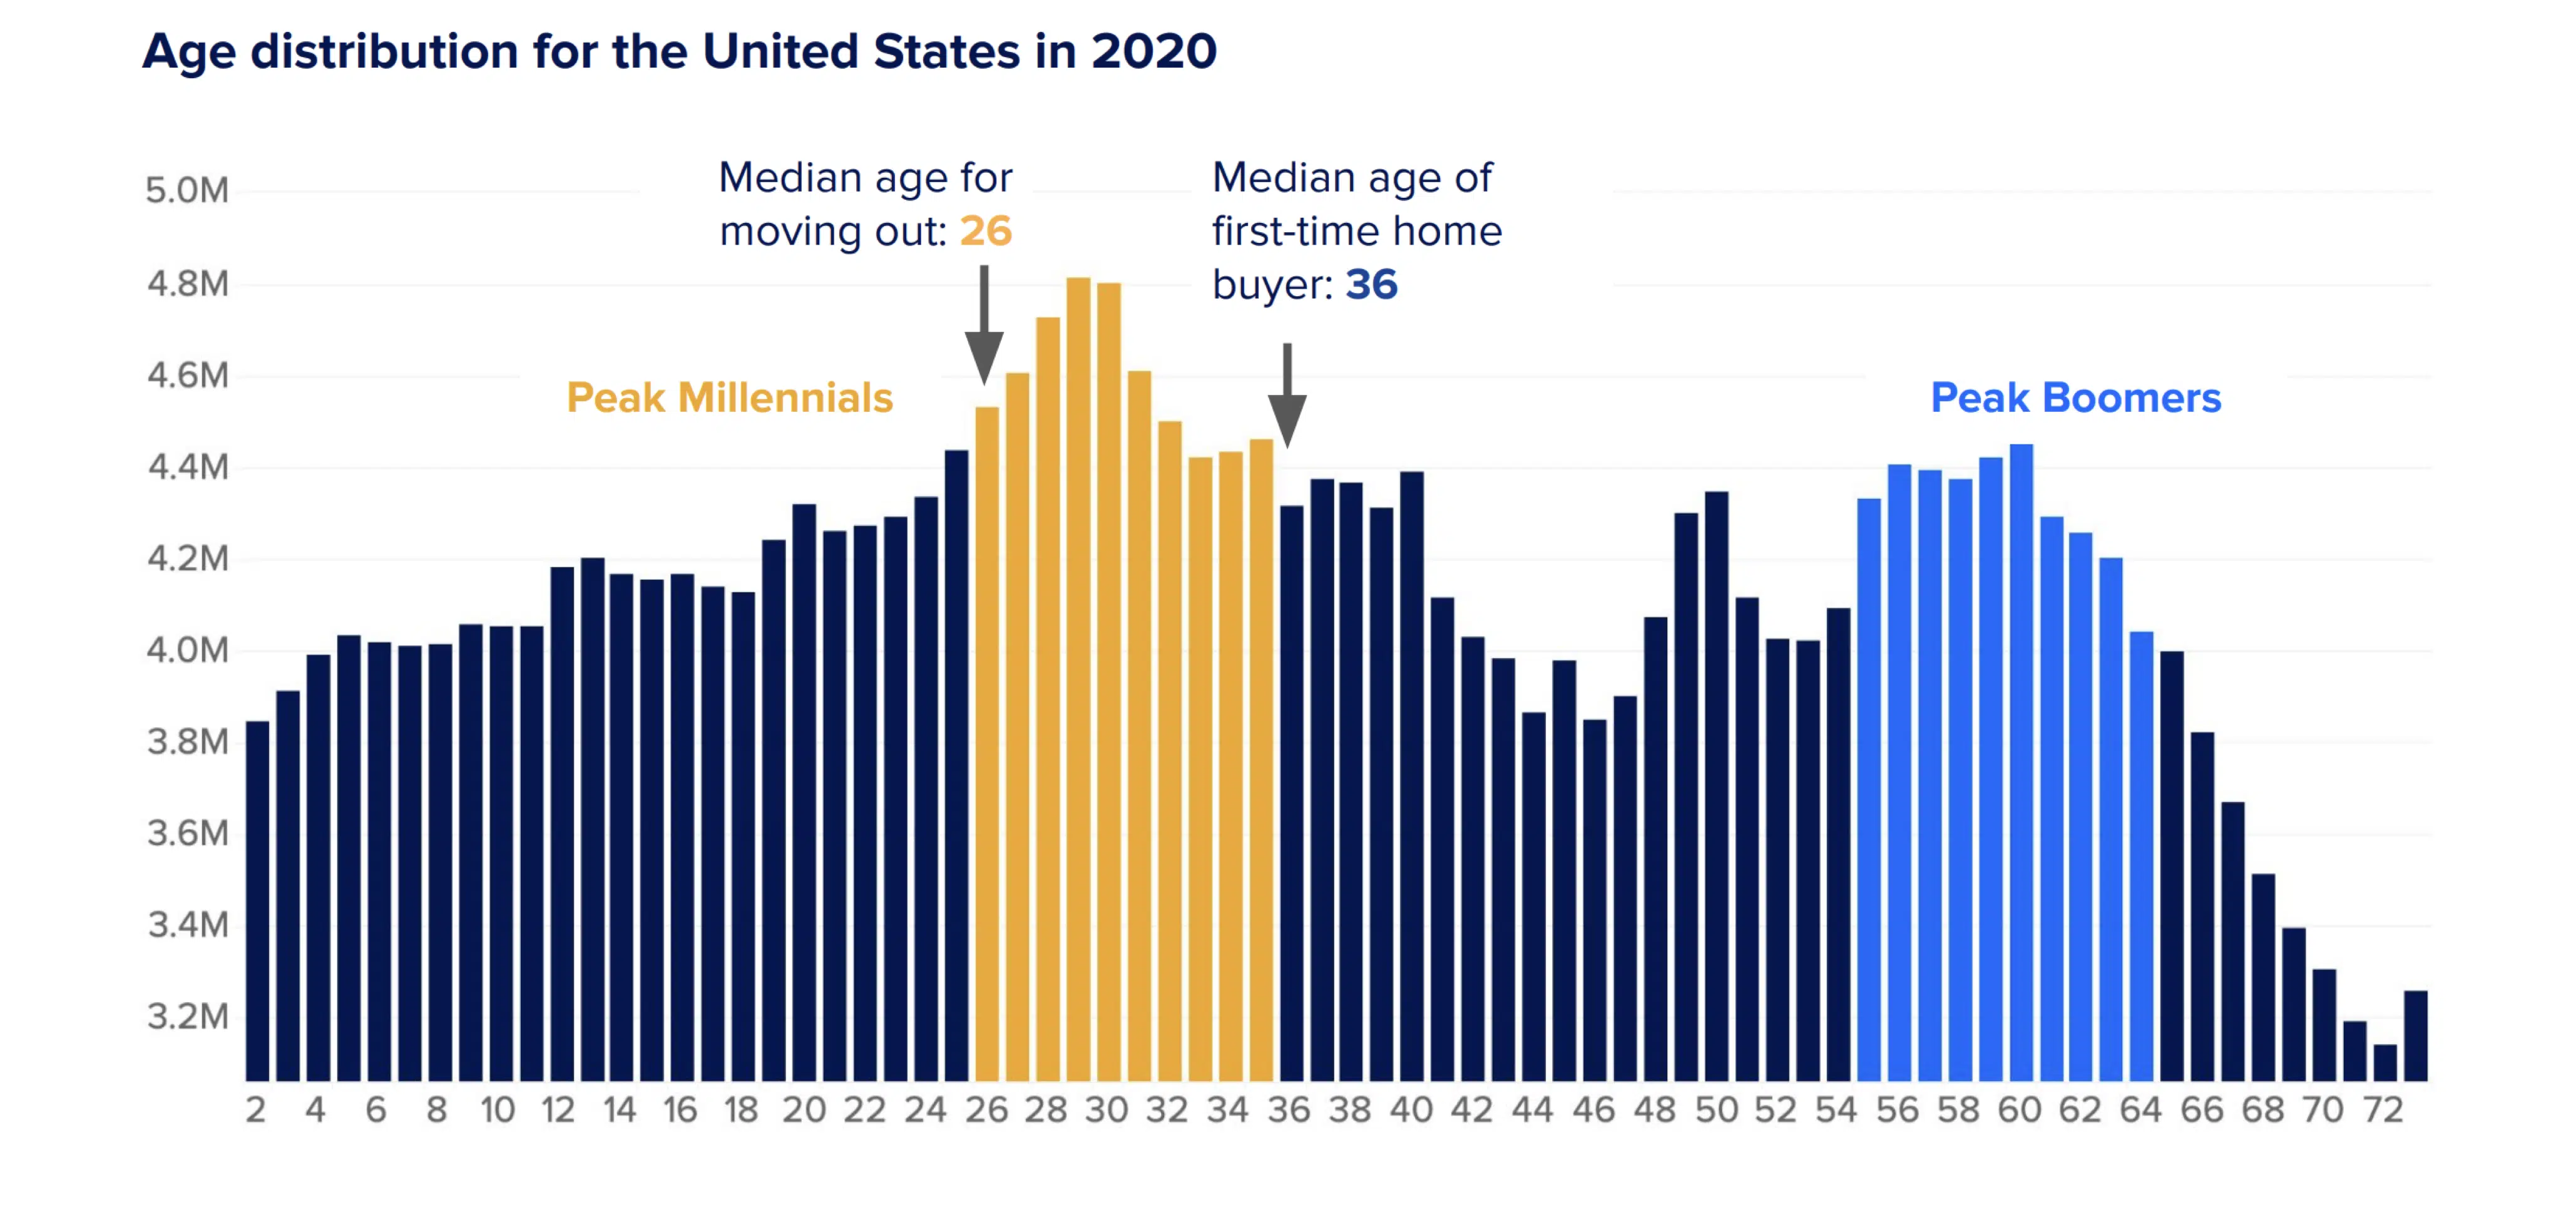
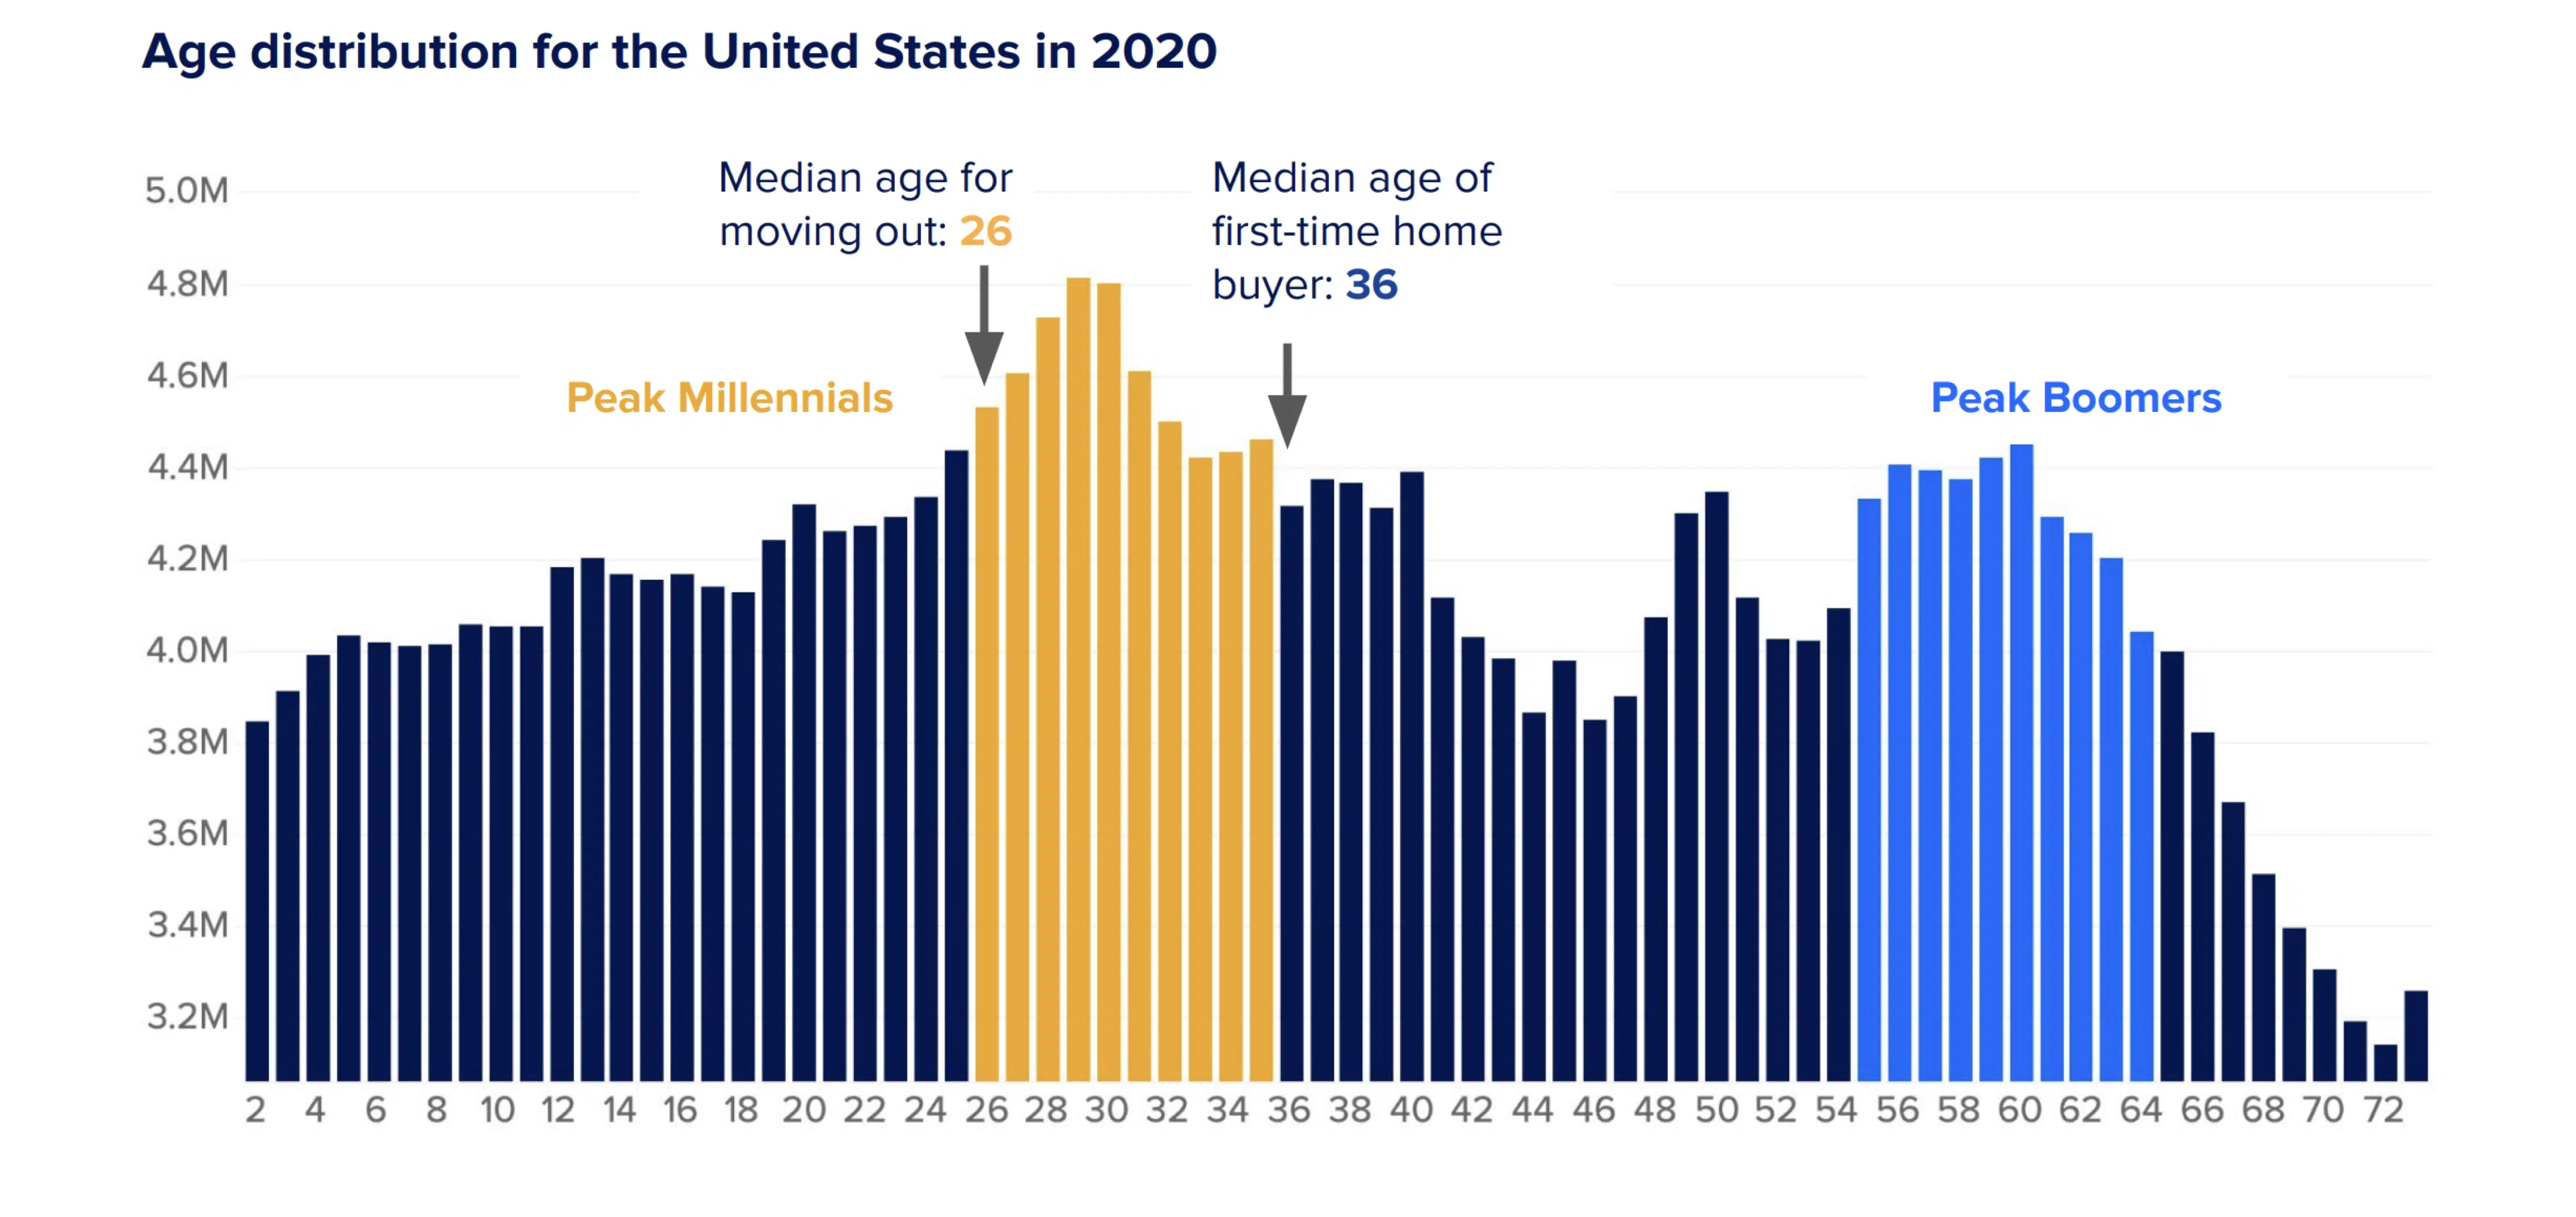
The US population movement to the south and east, when combined with the biggest single generation in the history of our nation (Millennials) hitting their prime home buying age, is benefitting our little community quite nicely – and will continue to do so for quite some time.
And for what it is worth, we have been saying all of these things for quite some time, too.
“So while our (affordability) problem feels smaller than their (DC or NY or SF) problem, just remember that their problems used to be a lot smaller, too, until they weren’t. When we ignore the issues, we do so at our own peril and while our affordable housing problem is not our biggest problem — yet — the stage is set for it to not only become far more problematic in the near future, but far harder to cure as well.”
From the Affordable Housing Post, March 2016
Yep.