• Skip to primary navigation
  • Skip to main content
  • Skip to primary sidebar

Sarah Jarvis Team at One South Realty

at One South Realty

  • Search MLS
  • Stats
  • Deals!
  • About Us
    • The Team
    • Testimonial
    • 5 Things I Tell My Clients
  • Calling Policy
  • The Blog
  • Show Search
Hide Search

New Homes

Rates Are Up. So What Happens Next?

August 4, 2022 By Rick Jarvis

In case you hadn’t heard, 30 year mortgage rates rose this year.

After falling below 3% for pretty much the first time ever in 2021, rates began a rather jarring ascent in January and peaked just above 6% in June.

This is not news.

Since June, however, rates have since settled back to somewhere between 5.2% and 5.5%, but the world markets are twitchy, and volatility is still the name of the game –– so stay tuned.

Rates ≠ Demand

As rates have climbed, so has the noise about how rising rates were going to somehow end the bull market in housing.

Sorry, I disagree.

Why? Because the bull market in housing is not about rates –– ok, not exclusively about rates.

Mortgage rates matter for sure, but the long term prospects for housing is currently less about rates, and far more about the systemic and underlying fundamental issues that are not anywhere near being addressed.

Let’s discuss.

What Drives Demand

Ok, so the increase in mortgage rates will decrease demand for housing, right? 

Nah.

Wait, what?!?

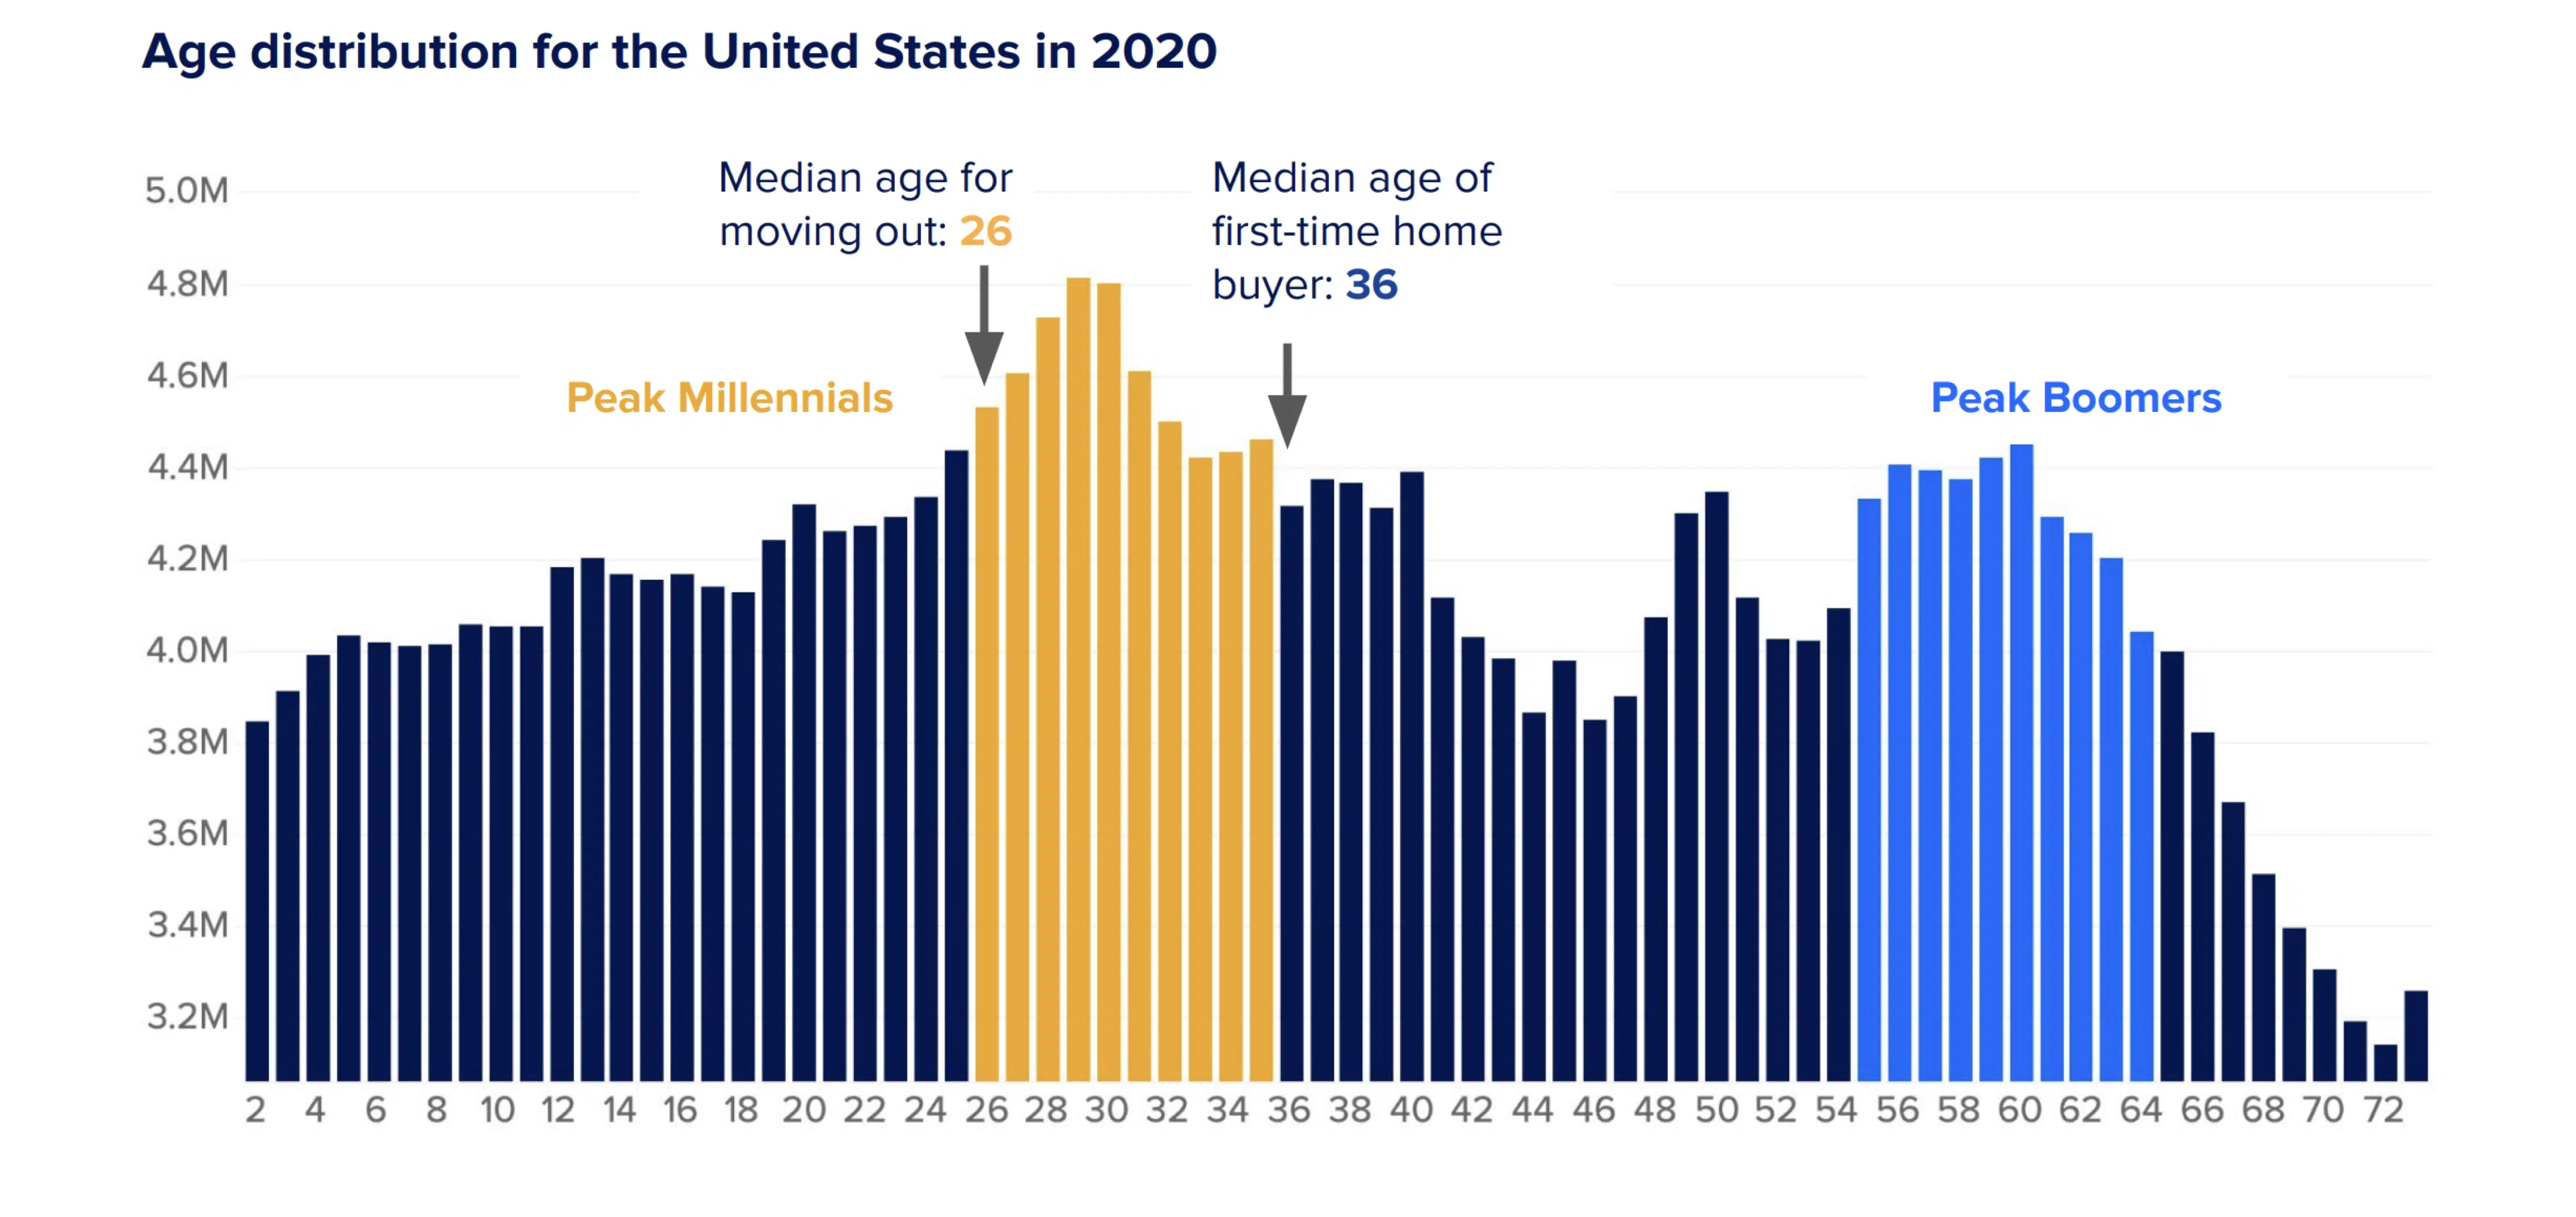
‘Higher rates = lower demand’ is a legit argument, yes, but here is the bigger one –– the Millennial Generation is the greatest consumer generation in the history of our country, they are just turning 30, and they are sick of getting pillaged by their landlords.

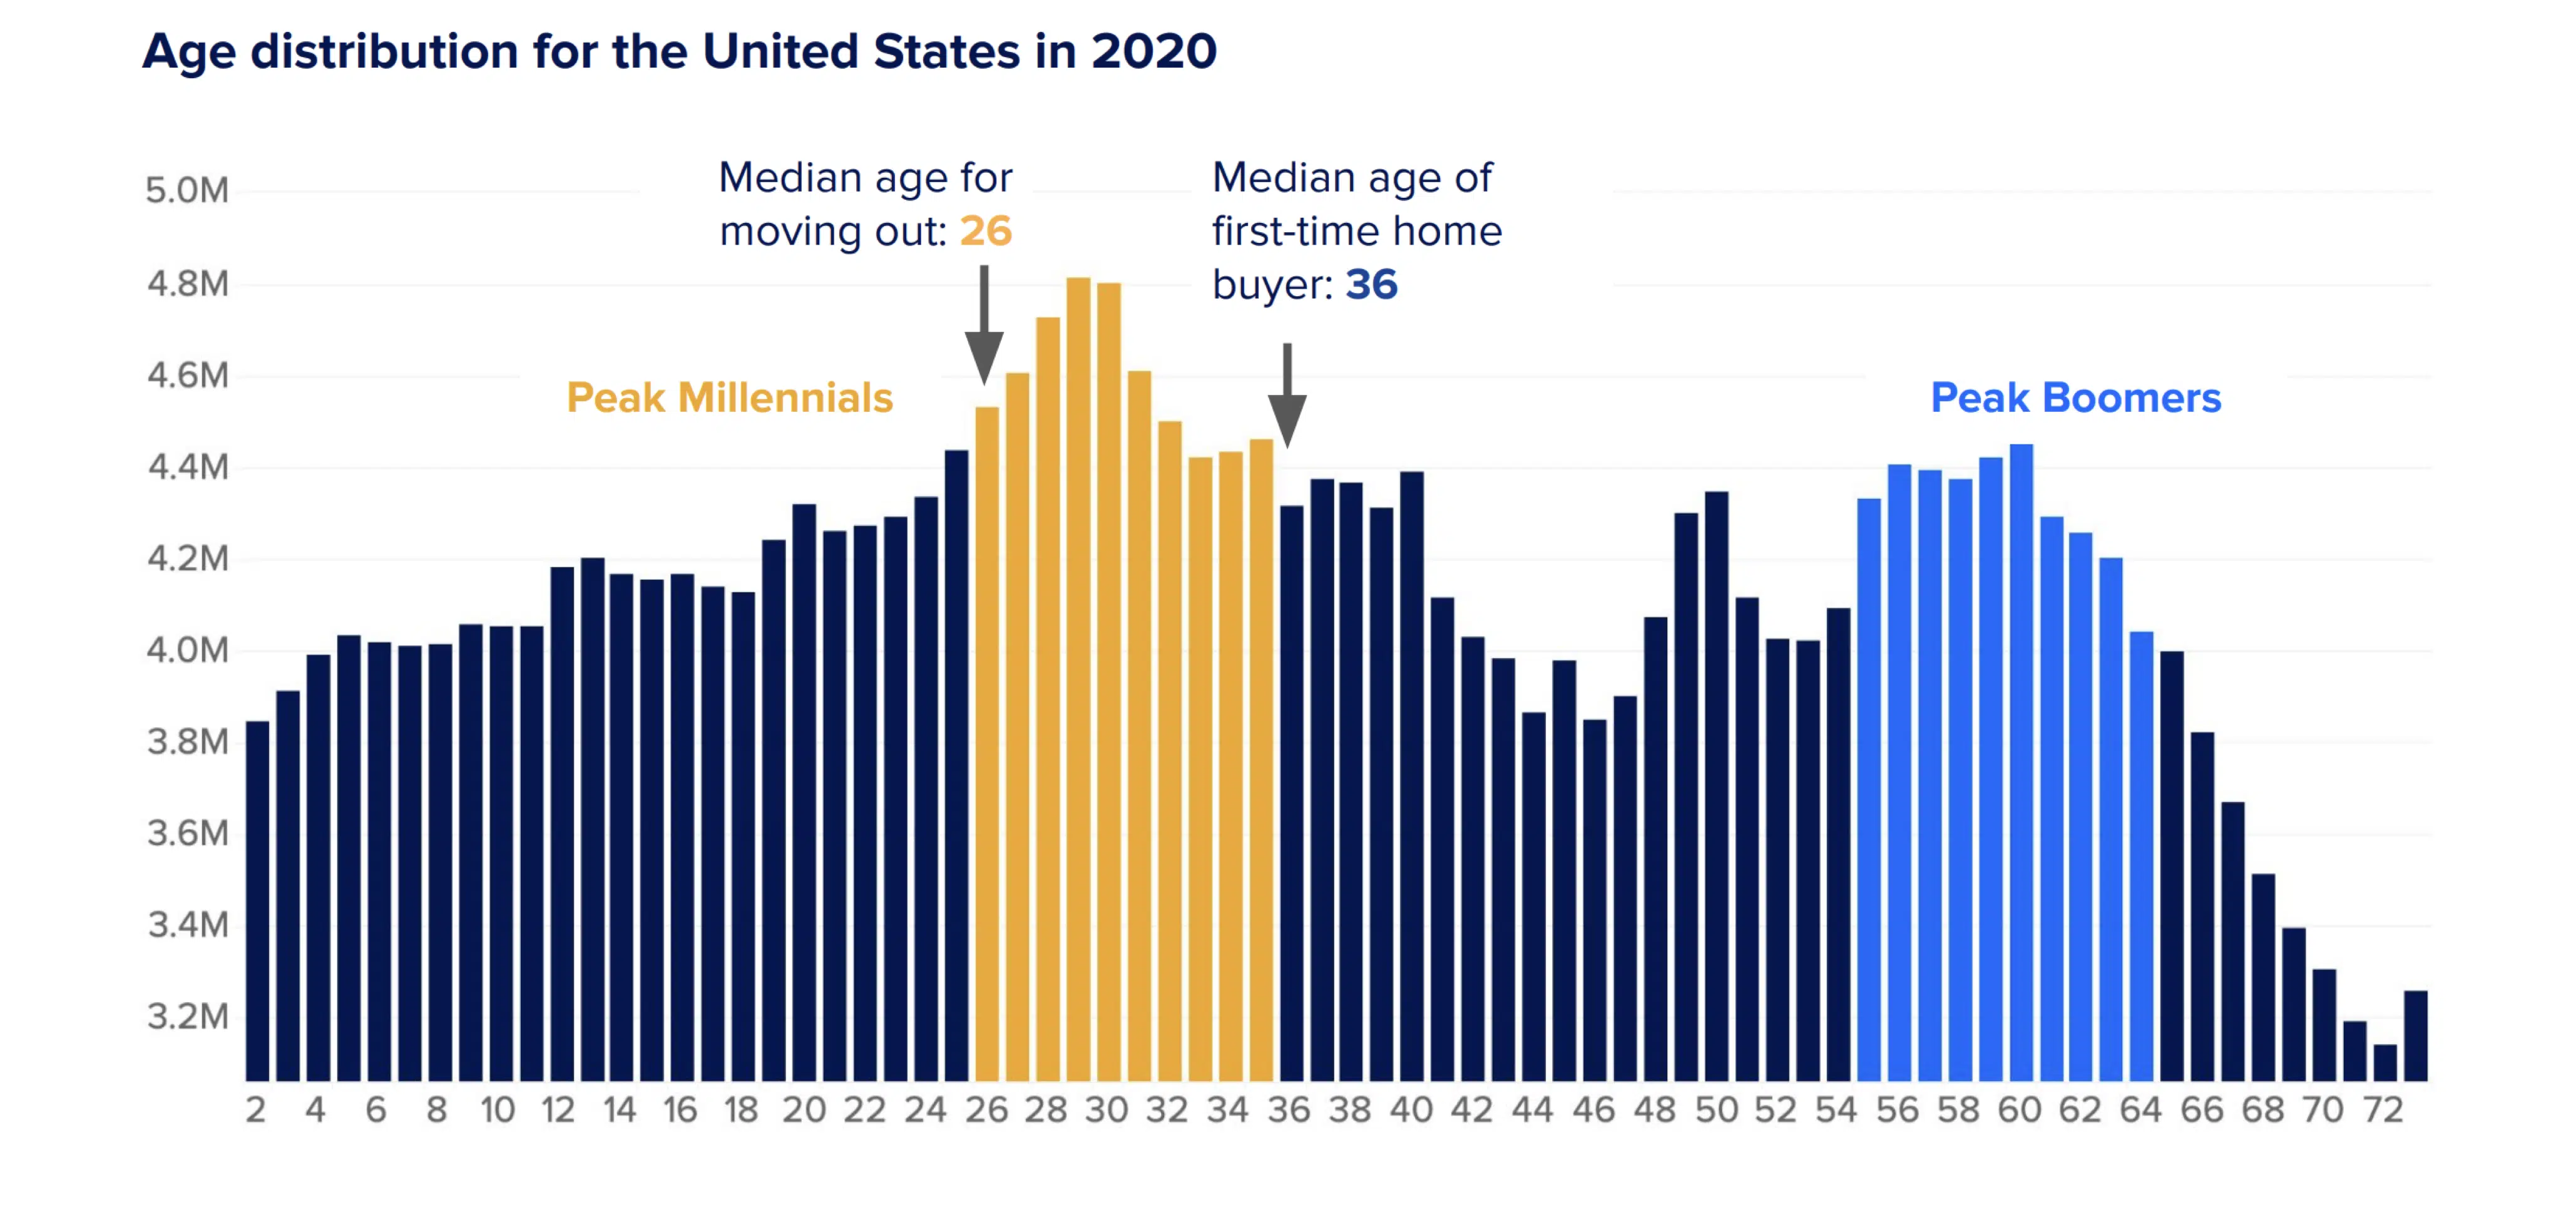
They want to own housing, just like every generation before them, but there is a total and complete lack of reasonably-priced housing options for them –– and thus the reason that that higher rates will have a minimal impact on demand and pricing.

Boomers and the 1950s Housing Boom

The last time we had a population bulge as pronounced as the Millennials, it began in the 1940s and 50s, due to the GIs returning home from WWII. The conflict-weary veterans wanted to forget about the horrors of war, settle down, get married, buy a home, and start a family.

And start a family they did –– we all know that demographic as the ‘Baby Boomers’ (aka Boomers.)

In order to satisfy the ravenous demand for the new ‘American Dream,’ the US construction industry managed to more than double its output from the previous decade to provide affordable housing options for everyone who wanted one –– it was the biggest increase in home building in our country’s history.

The leading edge of the construction boom began in the 1960’s and didn’t really cool off until the early 2000s.

But look what happened in the period after 2008 –– construction slowed dramatically.

The chart above shows the number of housing starts (new construction) adjusted for the population. In other words, ‘How many new homes were built for each person of population?’ That ratio should remain relatively constant through time in order to keep pace with population growth –– but it doesn’t.

As you can see, the rate of construction in the last decade is at least 50% lower, if not more, than every decade since the 60s.

And that lack of construction is now rearing its ugly head.

Small Housing is No More

So not only are we building fewer houses, we aren’t building affordable ones either.

Research Chart 2

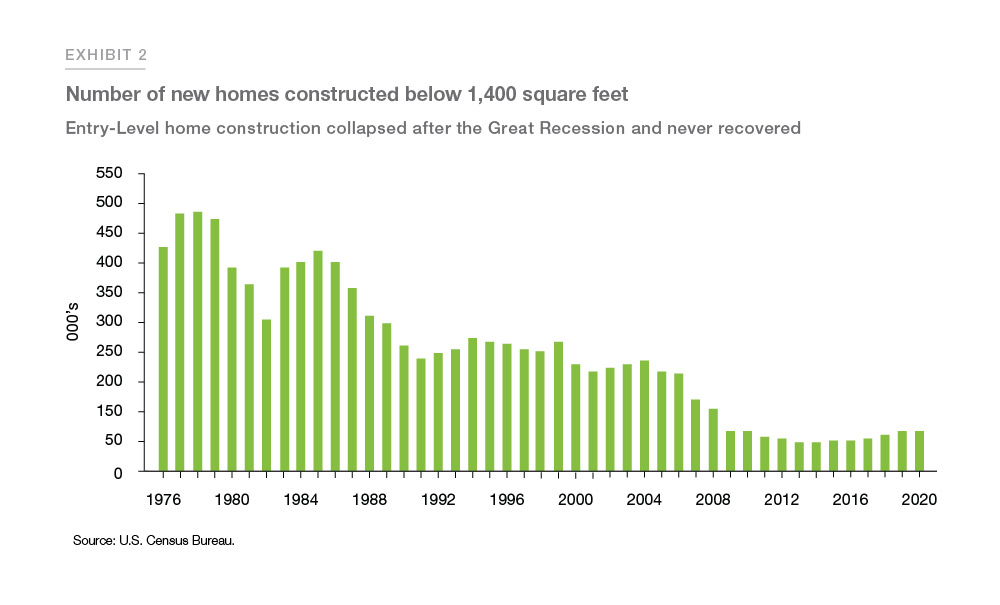
Anywhere from 35 to 40% of the homes constructed in the 70s and 80s was less than 1,400 SF. Today the number of newly constructed smaller homes is less than 10%.
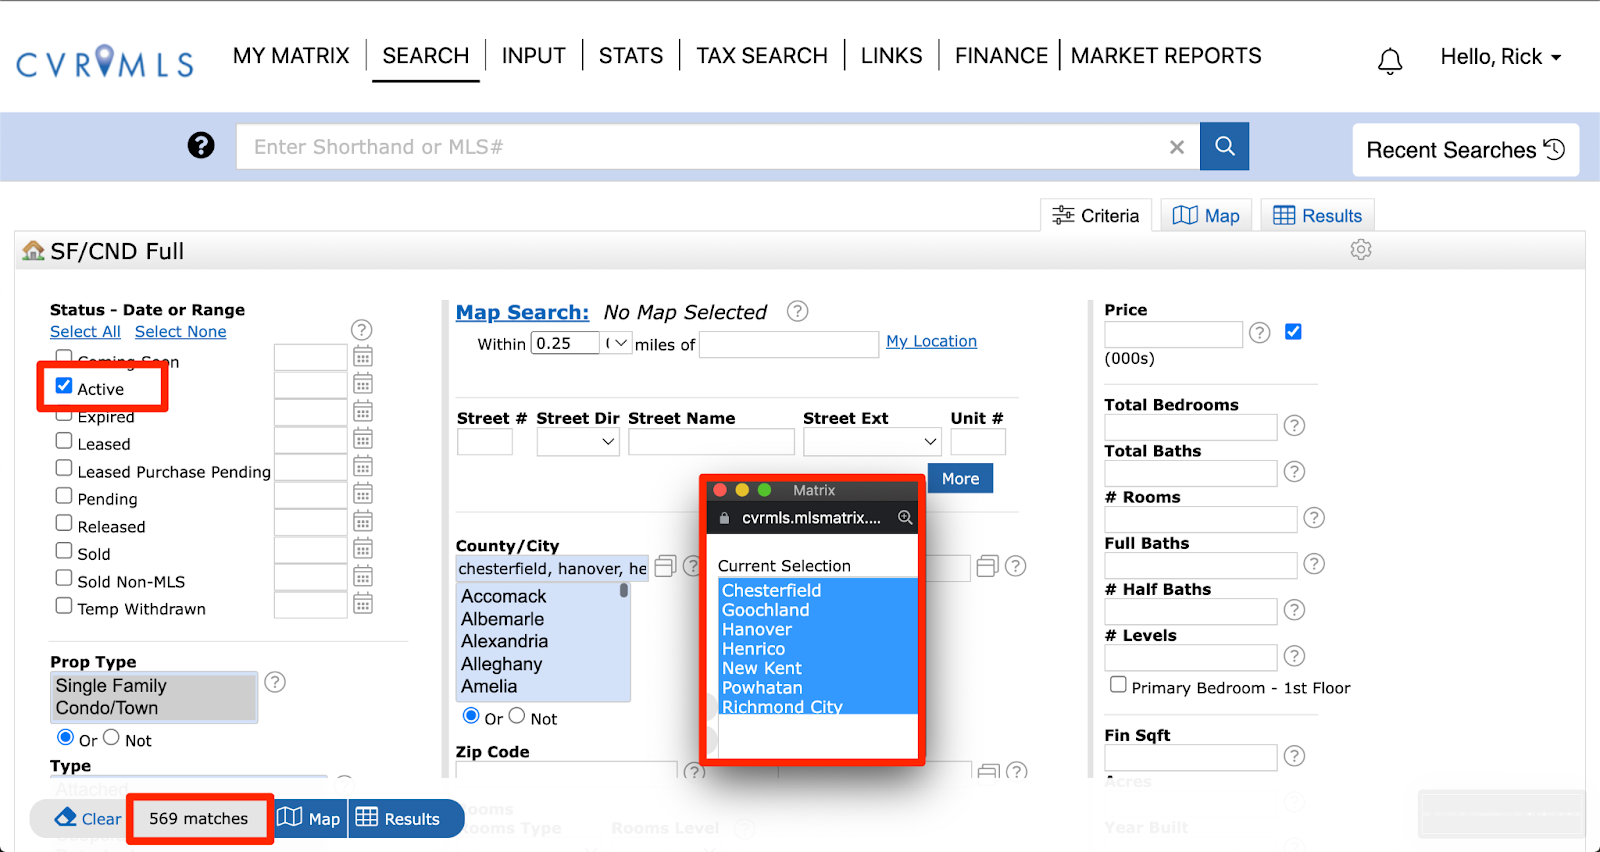
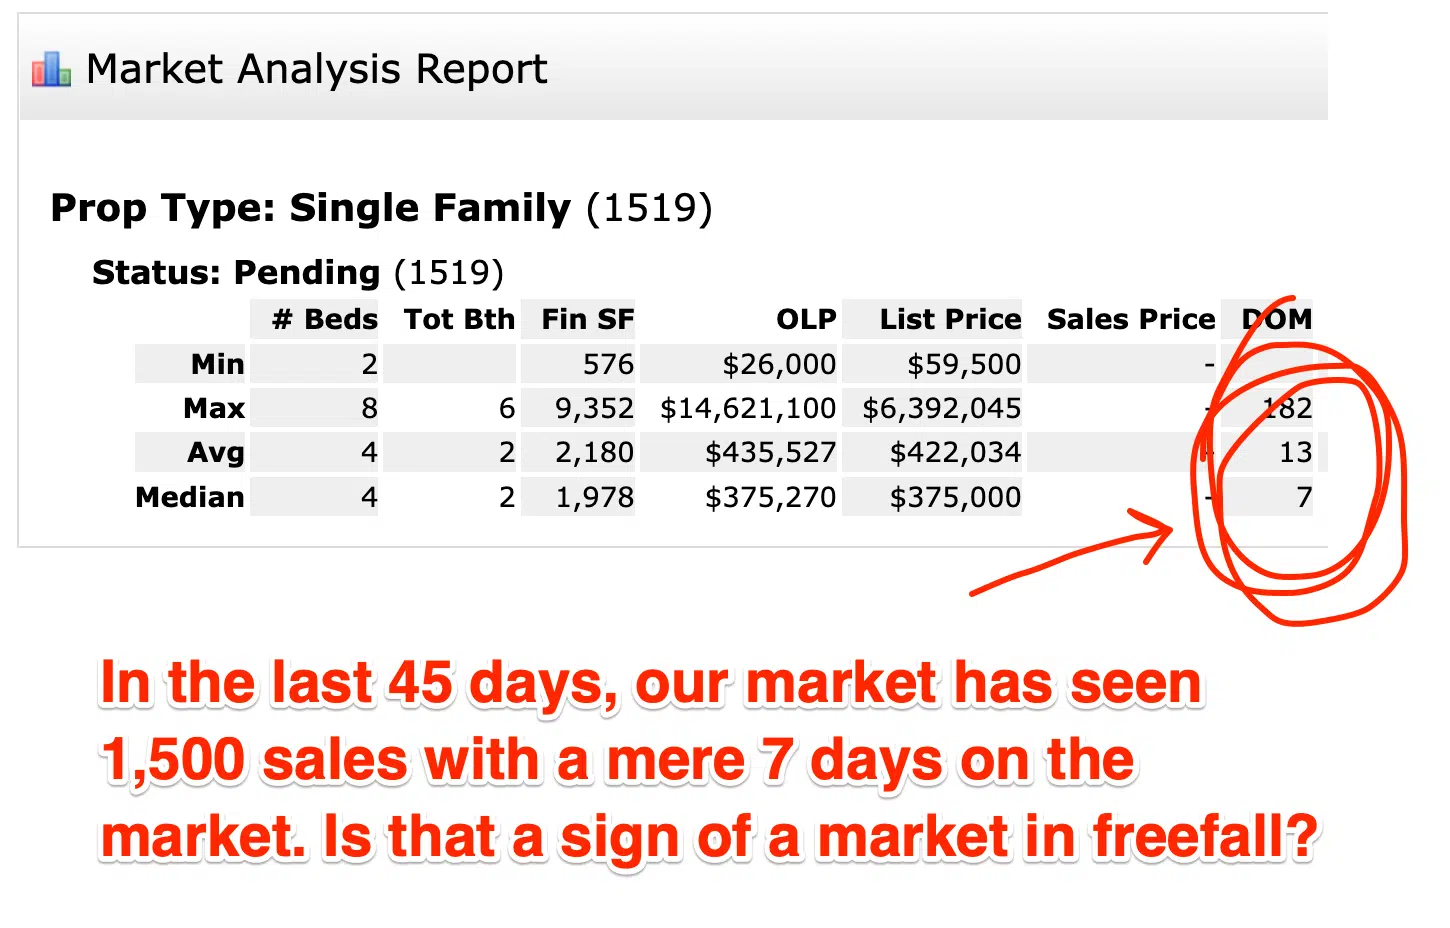
Our Market

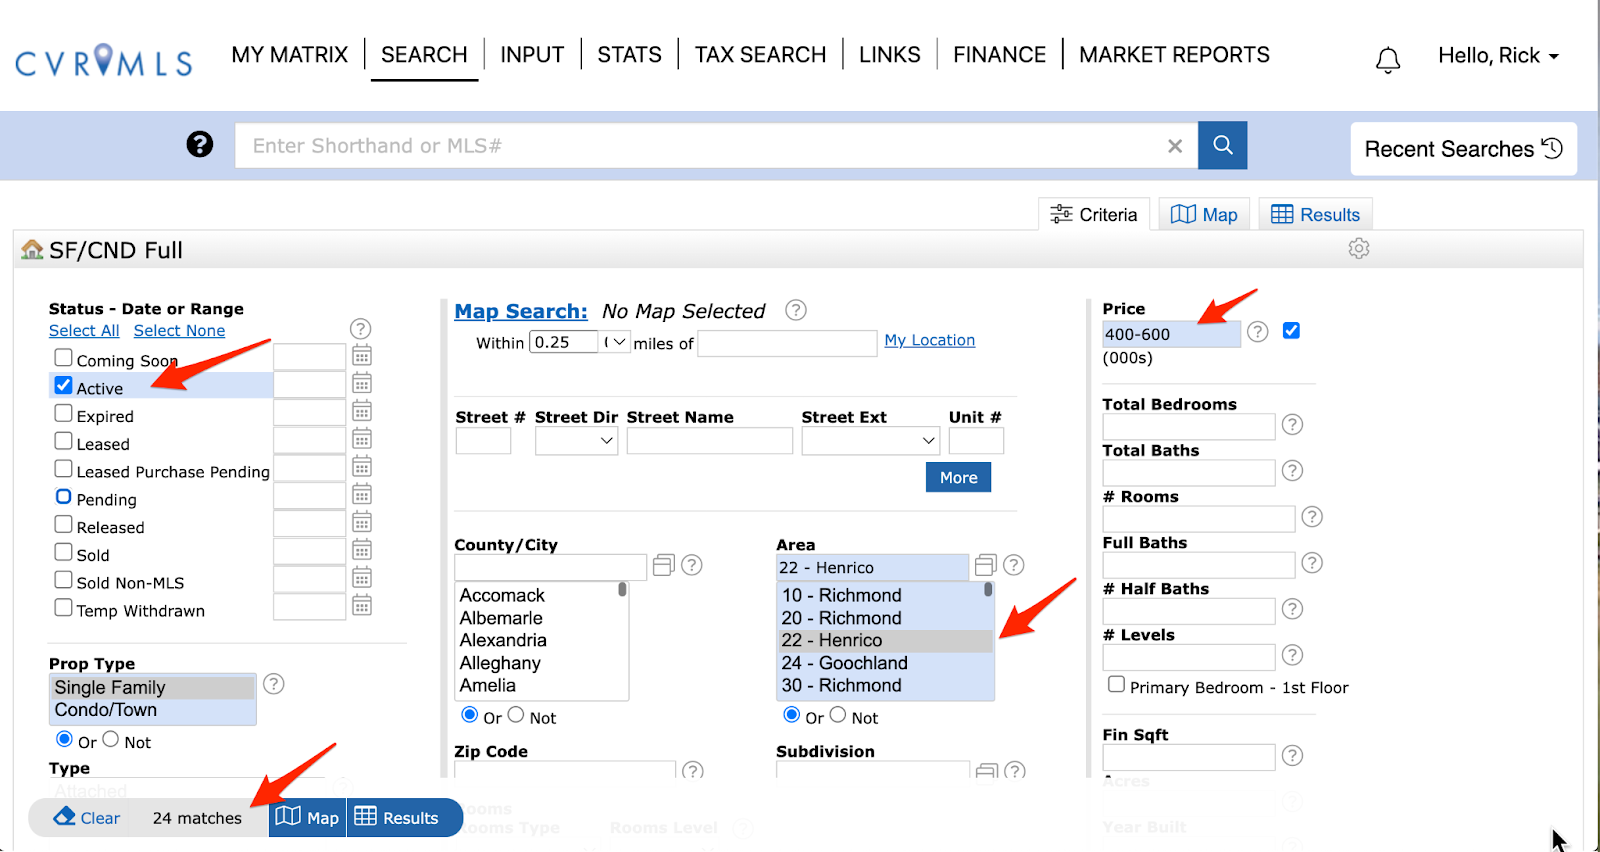
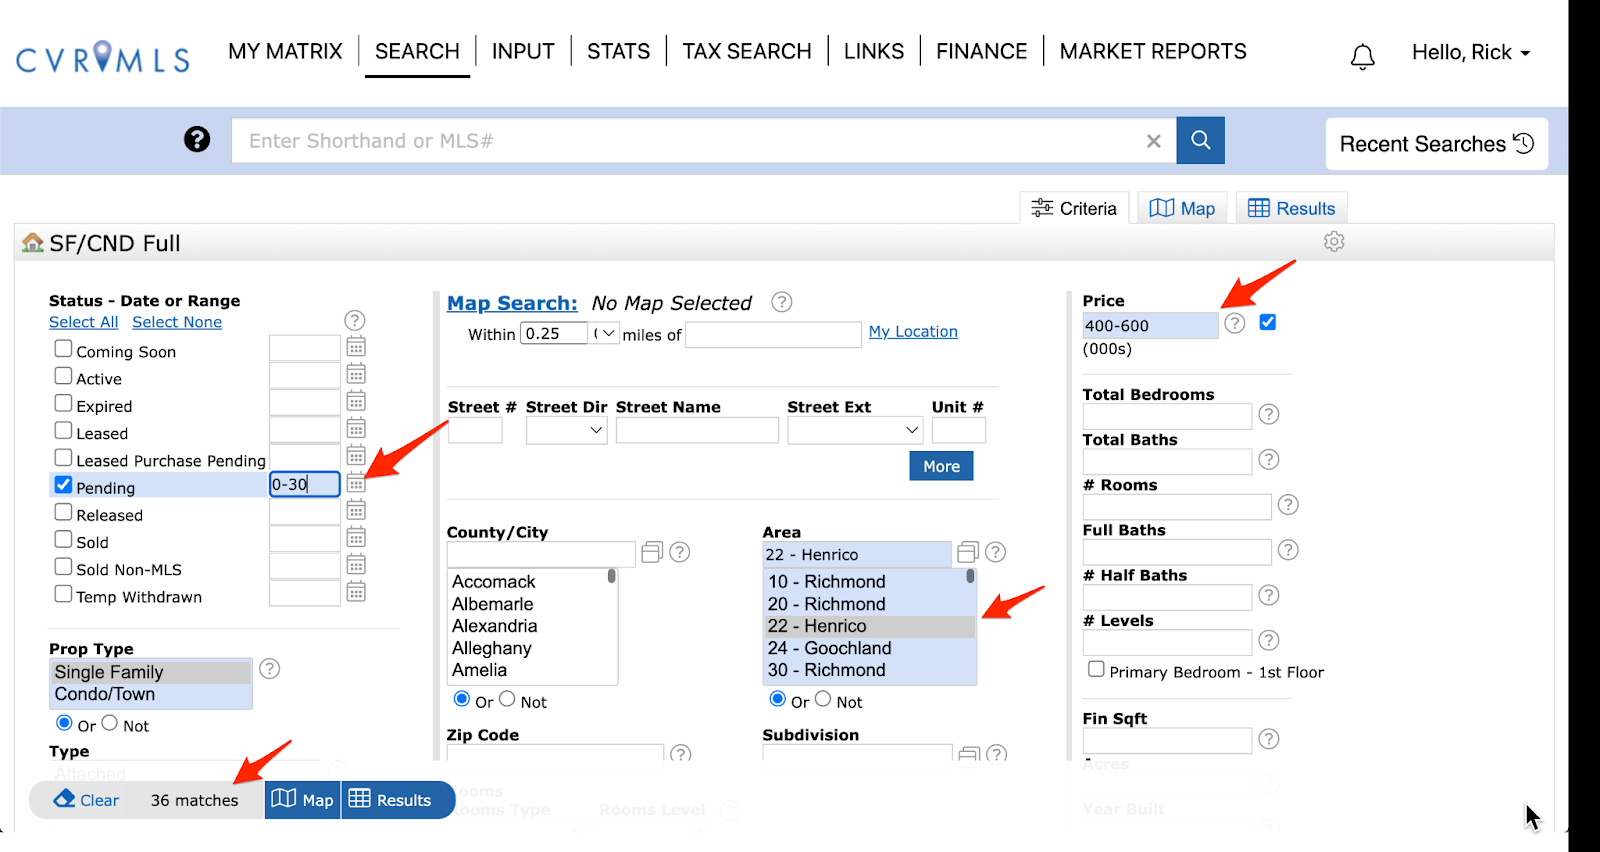
When I look in our MLS, I see the same thing.

A random sample of recent sales for houses built between 1940 and 1960 in Zone 22 (West End / Henrico) shows a median home size of 1,604 SF.

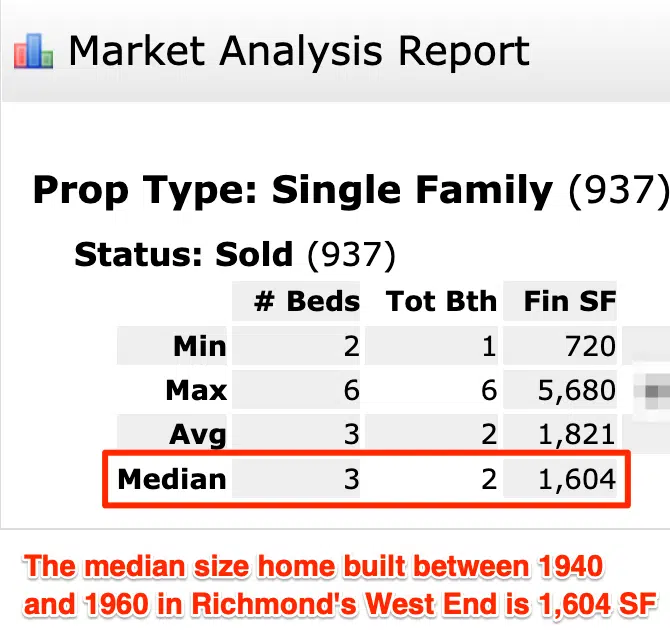
However, when you look at houses built later than 1990 in the same area, the median size jumps … substantially. For a myriad of reasons, the size of the homes we built in the last 30 years increased by over 40%, to 2,687 SF.

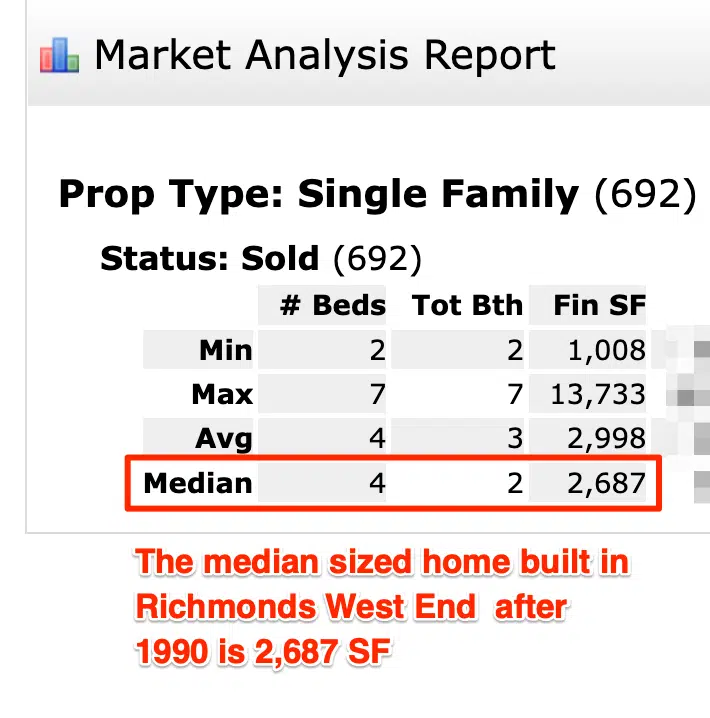
Bigger housing, and far less of it –– and we wonder why we have a housing crisis.

The Housing Deficit Isn’t About Mortgage Rates

“But rates are rising. that should take some pressure off the supply, right?”

Ask yourself, did the increase in mortgage rates:

  • Make builders want to build more? Nope, builders have actually slowed down.
  • Make developers want to develop more? Assuredly, no.
  • Make people with 2.5% mortgages want to sell their home and move to another one? Actually, it has had the opposite effect. Owners with low rates are staying put for longer.
  • Make investors want to stop acquiring rental properties? Of course not, investors buy with cash. They love the higher rates. 
  • Make investors want to sell their rental properties? See above. No way.
  • Cause the local Board of Supervisors to suddenly decide to approve affordable housing developments? Nope, voting ‘yes’ to affordable communities is a guarantee to get voted out.
  • Make NIMBYs suddenly have a change of heart about supporting affordable development? Not in the least.
  • Make apartment owners want to lower rent? HAHAHAHAHA! That’s funny.
  • Make all levels of government rethink their housing policies and repeal the layers upon layers of regulation that impede reasonably priced housing getting built? Uhhhh … no.
  • Decrease the cost of building a home? Not one penny. 

Sorry to restate the obvious, but there is nothing about higher mortgage rates that is addressing the undersupply. As a matter of fact, higher rates are actually MAKING IT WORSE.

Why? Because the increase in mortgage rates is slowing down the rate building and development AND it is making it easier for investors to acquire the affordable housing normally reserved for the entry point buyer –– which is the worst of all possible outcomes.

And thus, the idea that somehow mortgage rates in the 5s, 6s, or even 7s is going to magically create more housing at the price at which the median or affordable buyer can secure it is patently false. 

Rates and Qualification

Another important point about mortgages that seems to get lost when rates rise is that rising rates impact what people qualify for, not whether they qualify at all.

In other words, even with higher rates, buyers are still approved for a mortgage, just a far smaller one.

It’s when you change credit score minimums, debt-to-income ratios, job history requirements, and other underwriting rules, than you change the number of potential purchasers.

However, when rates increase, you don’t erase demand, it simply shifts from higher price points to lower ones –– from say $400K down to 300K –– which just increases the pressure on the one segment where the inventory is essentially fixed.

Removing access to subprime loans in 2008 shrank the buyer pool.

Rising rates in 2022 shifted the buyer pool.

it is a key distinction.

And remember, the lower a buyer moves in price, the fewer houses there are to choose from –– and (unfortunately) more cash investors to compete with.

The dreaded double whammy for the entry level buyer.

This Shouldn’t Be a Surprise

People forget that in 2017, 2018, and 2019, the market was already experiencing rapid price increases, bidding wars, and plummeting inventory. All the leading red flags that the market did not have the housing supply to handle Millennial demand were waving wide and high –– and we did nothing about it. 

Remember, mortgage rates hovered around 4.5 to 5% in 2018, and a record number of homes were sold at that time. And I won’t mention the mortgage rates in the 1980s and 1990s and the number of homes sold.

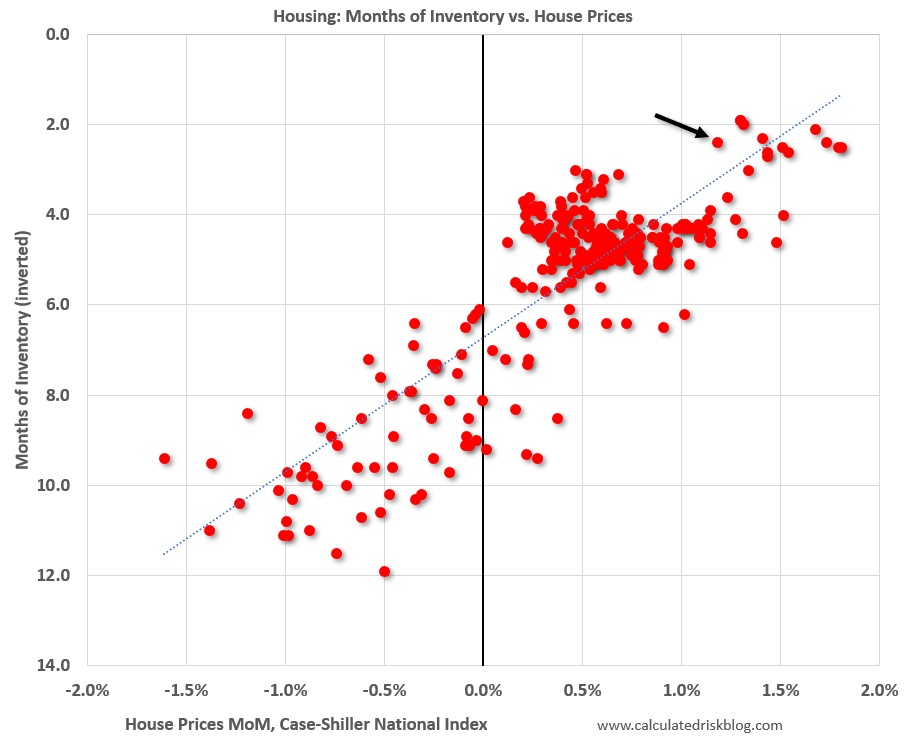
So don’t assume that sales, pricing, and 30 year mortgage rates are perfectly correlated –– because they aren’t.

Do Rates Really Matter?

I know, I know –– I can’t actually be so naive as to believe that when you make a mortgage payment nearly twice as expensive as it used to be, that won’t have an impact?!?

In the interim it might, sure. But I am talking about over the next few years and beyond, not the next few months.

When rates started to jump this spring, many prospective buyers elected to take a ‘home search sabbatical’ largely due to interest-rate-sticker-shock or perhaps delusions that somehow home prices will fall back to 2020 levels.

But my contention is that the ‘wait and see’ approach that many buyers adopted as rates jumped will prove to be futile. The 3% mortgage is now a thing of the past and a 30% price decrease is exceedingly unlikely for all of the reasons stated above –– especially at the median and lower price points, and / or mature areas where the supply of housing is essentially fixed.

No, once the lease renewal comes back with another 10-15% increase, buyers will swallow hard and accept the current rates as the new normal –– and we will be right back to crisis mode. 

2023 and Beyond

I get it, when COVID arrived in early 2020 until today, prices spiked. By most estimates, prices across the board increased +/- 30%, depending on your market and the price point.

A 30% increase in 18 months feels unnatural, and 2008 so ably taught us that just because the housing market hadn’t crashed since the Great Depression, it still could. 

Renting simply isn’t a good idea.

So I get the fear. A lot of people still have scars from the last downturn –– myself included.

But this isn’t 2008.

Will the prices pull back some this fall, or even next spring? Perhaps, but there is conflicting evidence. Some regions have seen more softness than others, while some (like ours) have continued to plow right ahead.

And thus, I encourage everyone to look at the market fundamentals and not simply have a knee jerk reaction to the noise.

I fully acknowledge that a 5.5 to 6% mortgage rate seems high when 12 months ago they were 2.8%, but when your choice is between a $2,500/mo rental payment (rising 15% per year) and a fixed rate 6% mortgage, the answer becomes painfully obvious.

So before we write off the entire market and declare ‘2008, The Sequel!’ just because rates increased to somewhere still shy of historical norms, look at what lies beneath the surface –– a housing availability crisis that is colliding with the biggest population bulge in US history.

The bottom line is that there are more people who want houses than there are houses to go around, especially in the median and lower price –– and that is not only highly unlikely to get better for quite some time, but very likely to get worse.

A Few Notes / Other Thoughts

The New York Times wrote a great op-ed about the housing crisis that I think is 1,000% correct. It requires a free registration in order to be able to read, but totally worth it –– We Need to Keep Building Houses, Even if No One Wants To Buy

After I hit ‘publish’ on this article, the following post showed up in my Twitter feed, it was written in March 2022, so it is a little bit dated, but I would say that either Twitter was spying on me or I am not alone in my opinions –– Home Buyers: Don’t Wait for Prices to Drop in 2022

Finally, a great piece that proposed a counter to the argument that we have a housing undersupply. I am not sure I agree, but the author makes some interesting points –– How Much Housing Do We Need?

It’s (Still) All About Inventory

July 16, 2022 By Rick Jarvis

For those of you who know me, I don’t think the following will come as a surprise to anyone:

  • I follow a lot of bloggers 
  • I read a lot of articles 
  • I listen to a lot of podcasts

The bottom line is that I spend considerable time nearly every day consuming information on all things real estate. 

And in my time researching the market, I have come to one irrefutable conclusion. 

If you only want to follow one metric to understand how your market is doing, follow ‘inventory.’

Inventory is a Calculation

Now, when I say ‘inventory,’ I am using the term in a very specific way. 

Inventory, when used in real estate, refers to a specifically calculated metric that effectively measures the ratio of buyers to sellers.

Why is it so important? Two reasons:

  • Inventory measures the market currently, unlike closed sales which measure the market 45-90 days in arrears
  • Inventory is strongly correlated with price movements and can be used to forecast price appreciation –– but more on that in a moment

Definition

Inventory is defined as follows: it is the ratio of ACTIVE homes for sale relative to the number of homes that have been ABSORBED (gone under contract) in the last 30 days. The measurement is stated in terms of ‘months’ or ‘months of supply’ and answers the following question –– How long would it take us to run out of homes to buy if nothing new hit the market?

Inventory = Availability (Sellers) / Absorption (Buyers)

Example: 1,000 homes for sale / 500 homes pending in the last 30 days = 2 months of inventory. 

Make sense?

Inventory Comprises All

Inventory is the ultimate measure of any market.

Why? Because it combines all market inputs into one simple ratio.

Every input either impacts the number of buyers or the number of sellers:

  • Building costs? That is a seller side input
  • Credit scores? Buyer side
  • Interest rates? Mostly Buyer side … but interest rates can impact how many homes a builder can build, too.
  • Jobs? Buyer side.
  • Lot supply? Seller side.
  • Building codes. Seller side.
  • Rents? Buyer side.
  • School ratings? Buyer side.
  • Commutes? Buyer side.

I could go on and on, but you get the point. 

Any and all factors that impact the market manifest themselves in the inventory calculation by either creating more or fewer buyers or sellers.

Inventory and Appreciation

Robert J. Shiller - Wikipedia
Robert Shiller, Nobel Laureate

Nobel Laureate Economist Robert Shiller (and author Irrational Exuberance), has dedicated much of his work to the study of real estate.

Most real estate pros are familiar with the Case-Shiller Index, which looks at median home prices –– both nationally in the aggregate, and in 20 different metros, individually. The Case-Shiller Index, introduced in the early 90s, is considered the gold standard of home price appreciation measurements.

But in addition to the national measurement of home prices, he also created a matrix that plots inventory levels against price appreciation / depreciation.

As you can see, the correlation between the two is rather obvious –– when inventory drops, prices not only rise, but by a somewhat predictable amount. And when inventory rises, price growth slows –– or even falls –– depending on how far inventory rises. 

Show me the inventory count in any market segment and I can tell you an awful lot about how that market is behaving.

Observations

A few observations jump out at me –– which I feel are critical to note as the market is changing:

  1. Housing inventory tends to hover between 3 to 5 months historically (in other words, 3 to 5 months of inventory is what most consider to be a ‘normal’ market) 
  2. Prices flip from rising to falling anywhere between 6 and 10 months
  3. At no time in history have prices fallen with inventory less than 6 months, and even have risen with as many as 8 months of inventory
  4. There are far more instances of rising prices than falling prices

Why are these observations so important to note? Because we are so far from the critical inflection points, despite what the news and other media outlets might have you believe.

So Let’s Look at Our Market

Calculating inventory is not difficult –– if you know what you are doing, it takes about 30 seconds.

Pick a segment (say Zone 22 / Western Henrico between $400K and 600K) and count the active inventory (see screenshot below):

And then count the number of homes that have gone under contract in the past 30 days (see screenshot below):

As you can see, there are currently 26 active listings and 36 homes have gone under contract in the past 30 days (I pulled the info on 7/16/22.)

26 active / 36 pending = .72 months

If you then go to the Shiller matrix, you can see that at .72 months, the expectation of appreciation is still approaching 2% per month (roughly 18 to 24% per annum.)

In other words, still quite robust.

Yeah, But…

I know the counter argument is that as rates rise, the buyer pool will shrink. Yeah, I don’t disagree, but I think the buy side of this ratio is by far and away the less important of the two. 

Right now, we have the following conditions governing our market:

  • Home building is still lagging behind demand for reasons relating to labor availability, material availability, and lot availability. The collective deficit of housing has been growing since 2011 and we are still not building enough houses to keep up with demand, much less chew into the deficit
  • Building costs have increased so quickly that realistically, it is darn near impossible to build a single family home for less than $500K –– and generally it is closer to $600K
  • All of the people who bought and refinanced their home at 2.5 to 3% are now far less likely to move and re-enter the market with a mortgage rate in the upper 5s to 6% –– meaning the excess inventory needed to push down prices will not likely come from the resale side
  • Investors have accumulated a tremendous number of median priced / affordable homes and are similarly unlikely to bring them to market with rents rising at the pace they are
  • The least risky form of construction is to build apartments or other multi-family rentals, and many large homebuilders have already begun to shift their focus to building ‘for rent,’ further depressing single family detached construction

And thus, the likelihood of an inventory spike (think 2008) is extremely low and will remain low for the foreseeable future. Building isn’t going to provide the solution and now resales will also become far more scarce for the reasons discussed above.

As a matter of fact, I think the inventory issue is more likely to get worse than better once the market settles in and the Fed stops trying to squeeze out inflation –– but I seem to be in the minority in that opinion. I guess time will tell.

Don’t Mistake What I am Saying

Does .72 hold true for all markets? No, of course not.

Every market and every segment has its own set of dynamics.

Furthermore, just because inventory is low does not mean prices will rise at the maximum rate. If you notice on Shiller’s index, a market with 4 months of inventory can appreciate anywhere from 3% per year to closer to 12% a year, so it varies quite a bit.


Here is a sample of inventories across the RVA region:

  • Western Hanover (Zone 36) at $600K is currently 4.3 months due to several new neighborhoods where construction is prevalent
  • Downtown neighborhoods (Zone 10) at $800K is 1 month
  • Forest Hill Corridor (Zone 60) is pretty much 1 to 2 months at all price points
  • Goochland (Zone 24) at $600 / 700K is closer to 9 months, mostly due a lot of construction.

So don’t mistake this blog for saying that the market isn’t subject to adjustments, only that far more segments than not are still in extremely low inventory conditions and the ability to add new housing at scale and at affordable prices is next to impossible.

Summary

Look, it is easy to believe in the idea of that which goes up, must come down. 

But this idea of gravity and prices ignores the underlying inputs –– Millennials paying record rents are trying to become owners despite the fact that there aren’t enough houses to go around. 

Sorry, I don’t care that mortgage rates have doubled. Mortgage rates have not fixed the fundamental problem –– in some ways, the increase in mortgage rates have made the problem worse by shifting the buyer pool down the price gradient where even less housing is available, but I digress.

No, the real problem, which we are not currently seeking to solve, is that we can’t build houses fast enough or cheaply enough to satisfy the demand. The layers of regulation at all levels (federal, state, local, neighborhood) have made homebuilding an incredibly compliance-based endeavor –– and I don’t see any of the regulatory oversight of homebuilding becoming less problematic … ever.

Besides, this problem is not new. We tend to forget that housing prices were rising quickly well before COVID –– as a matter of fact, the affordability issue was easy to see coming.

How easy? We wrote this article in 2016.

So keep your eyes on not just inventory in the aggregate, but in your area and price band specifically. Odds are, unless you live in an area where new construction is prevalent, your inventory count is still 2 months or less –– meaning that your prices are in no danger whatsoever.

And to the buyers, if you are waiting for a market correction, I think you may be waiting for a while. Yes, competition has thinned to some extent, but as long as housing supply stays below demand, prices will continue to climb.

Free Beer, Inflation, and Real Estate

May 19, 2022 By Rick Jarvis

Feels a bit odd right now doesn’t it?

  • We have war going on.
  • COVID is lingering / re-surging. 
  • Supply chains are still nowhere near functioning properly.
  • Inflation is raging.
  • The Fed has proclaimed inflation is ‘Public Enemy #1’ and seems hell bent on wringing it out of the system, regardless of the damage it does.
  • Mortgage rates have come close to doubling in the past 90 days. 
  • The stock markets have shed trillions in collective value.
  • Crypto is down by more than half.
  • NASDAQ is down about the same.
  • And the Supreme Court is now leaking documents.

Did I miss anything?

Real Estate

So I did miss one thing –– real estate. 

Right now, if you read the blogs and reports coming about Q1 of 2022, you will hear nothing but things like ‘prices set new record’ and ‘inventory at all time lows.’

But if you also ‘doom scroll‘ Twitter, or listen to CNBC, you hear a far different story. Inventories are rising, traffic is down, and price reductions are becoming far more common.

So which is it? Is real estate going to continue its torrid price rise despite rising rates, rampant inflation, and all of the other upheaval brought to us compliments of Covid and Putin?

Or should we brace ourselves for 2008 Redux?

Here is what to watch.

Lending Update

On January 1, 2022, the 30 year mortgage rate was hovering around 3%. 

By May 15, 2022, the 30 year rates stood at 5.5%.

Not only did the rates nearly double, the rate at which they jumped was particularly jarring –– never in the history of the capital markets have rates ever risen this quickly. 

And, yes, it is having an impact.

Qualifying vs. Underwriting

But while most of the messaging is that buyers now no longer qualify, in reality, what it means is that they simply qualify for less. The uninformed conflate mortgage rates with underwriting –– and they are two different things. 

Underwriting removes people from buying pool because of things like credit scores or how income is counted –– rising rates simply move a buyer down the ladder.

That is a key distinction. 

Unlike 2008, when buyers were removed from the buying pool because the loans went away, today, the rising rates has made owning more expensive. The buying pool is still the same size, they just qualify for less.

The takeaway here is that the most intensely contested segment of the market –– the entry point –– won’t change that much. 

Might we see weakness at higher price points where homebuilding is more common? Perhaps, but unless we see a spike in additional homes coming to the market at or near the median price points, the buyer / seller imbalance is so dramatic that I still don’t think we will see much slowdown. 

Inflation

Low rates didn’t just drive housing prices higher, they pushed all asset values higher.

Additionally, the response to COVID (give everyone money to stay home) flooded the system with free excess cash.

So what happens when you give away money and drop rates to nearly zero?


Remember ‘The Hangover? ‘ Yeah, that.

Inflation.

When COVID hit and we went into lockdown, the Fed flooded the system with currency in an attempt to keep everyone flush with cash until we got the pandemic under control.

It can be argued that the stimulus had the desired effect –– at least initially.

The Monetary Hangover

But free money is a lot like free beer, it sounds like a great idea at the time but comes with a severe hangover later –– especially if you keep drinking it well past when you know you should.

Well, now is later and we drank WAY too much. 

Currently, Inflation is just over 8% and the cost of goods and services are far higher than pre-pandemic, with not a lot of relief in sight. 

Killing Inflation

The good news is that the Fed has already begun to change its policies in order to stave off inflation. The bad news is that it only really has two levers to pull and both have the impact of driving up ALL forms of interest rates –– mortgage rates included.

As most everyone now knows, rates shot skyward faster than at any point in history –– from roughly 3% at the beginning of the year to 5.5% by mid-May.

While the last week or so has brought some stability to the mortgage rate environment, it hasn’t meant that rates have decreased, only that they flattened for a little while to allow the market to assess the impact of the last rate jump.

Until data shows that inflation is slowing dramatically, expect rates to keep ticking up. 

The 3% Mortgage’s Legacy

Which brings us to the unanticipated –– and extremely problematic –– part of the hangover.

Pretty much anyone who purchased a home prior to January of 2022 has more than likely refinanced their mortgage as rates dropped –– and is now sitting on a +/-3% mortgage. Depending on the study you read, something like 75% to 80% of all mortgage debt is now at or below 4%.

Think about it –– who in their right mind is going to give up that rate? And then turn around and buy into a market with 5.5% rates and less than 1 month of inventory? 

I doubt there will be many –– and therein lies the new problem. Inventory is already at record lows, and now anyone with a 3% mortgage is probably not going to sell unless they absolutely have to –– further depressing inventory.

The economic idea that rising prices leads people to want to sell, at least in this case, is not accurate. The increased cost of capital is proving a far stronger deterrent than rising prices are an incentive.

Gotta be honest, I didn’t see that problem coming.

Inventory

So despite the idea that people with 3% mortgages are unlikely to sell, the rise in rates and the crash of the stock markets is removing liquidity (a.k.a. –– the free money) from the system.

As a result, housing inventories are starting to rise nationwide –– albeit at radically different regional rates. When the cost and availability of money changes, demand is impacted.

So how is Richmond being impacted?


A view inside of our MLS. When you exclude the new housing inventory (which is inflated by homes that are ‘To Be Built,), then you see that we are still well below pre-pandemic levels.

When we entered the pandemic (March of 2020,) we were already experiencing some of the lowest inventory conditions ever. Most of the US was in what would be considered a strong seller’s market with somewhere between 2 and 3 months of inventory.

After a brief lockdown-induced pause, the Great Migration buying frenzy bagan and inventories started to drop from ‘lowest of all time’ to ‘is zero inventory actually possible?’

For Richmond, we spent the large majority of the pandemic measuring our inventory in weeks, not months –– and that has not changed. As this blog is written, we are still less than a month (.80 to be exact) despite the rate jump and other economic headwinds. 


We created a chart to show how market conditions are a continuum. By tracking inventory, you really know just about everything you need to know about where the market stands.

So when inventories start to rise (and it is inevitable that they will,) realize that even pre-pandemic levels aren’t enough to fundamentally change the market. 

I’ll start to pay attention when we have 3,000 -4,000 homes for sale, not when we move from 500 to 600.

Rents, Migration, and Millennials

‘So I will just wait for the market crash and buy a home when prices fall and rates pull back,’ has been a common refrain amongst every renter who has tried and failed to buy a home. 


The biggest generation in US history is just now entering the housing market. and we are woefully unprepared for it

I am sorry, that was a poor strategy. 

Right now, rents are up somewhere between 20 and 30% depending on your market, vacancy rates are effectively zero, and the leading edge of the Millennial Generation is just now maturing home buying age.

And did I mention that Richmond’s population is growing at some of the fastest rates in the country? In the time period following the arrival of COVID, Richmond’s growth rate has exploded –– mostly due to migration from regions of far higher costs of living. 

All of the other financial stuff aside, the fundamental issue is that we don’t have enough places for people to rent OR own, and it is spiking the cost of both. 

Congratulations, Richmond! All of the good stuff we have been saying about ourselves finally paid off. People from all over this great land heard our message and moved here –– now if they could only find an affordable place to live…

Summary

I get it, you can’t (almost) double the mortgage rate in 90 days and not have an impact. 

I expect at some point we will see rates of price increases slow somewhat, especially if we don’t get the cost of gas and food down. 

But regardless of all of the complexities of modern monetary policies and inflation, the fundamentals that underpin housing are quite simple –– how many buyers are seeking housing versus how many sellers have one to sell?


Think building is going to help offset demand? Yeah, might need to rethink that.

Right now, the number of purchasers so far outweighs the number of sellers that I don’t really care much about rates, or the economy, or inflation, or Ukraine, or COVID. 

We don’t have enough of any kind of housing to satisfy the demand that is already here. 

This problem has been steadily building since the devastation of the construction industry on the heels of 2008. We should not be surprised that we are here.

The Sky Isn’t Falling

March 28, 2022 By Rick Jarvis

Oh, I hear it, too –– ‘These house prices are unsustainable’ and ‘just wait until the interest rates rise’ or ‘remember what happened last time.’

< yawn >

When it comes to housing, nearly everyone has become a Chicken Little and is predicting that the ‘sky is falling!’ As a matter of fact, the whispers of an overheated market date back to 2015 when home prices started rebounding quickly from the depths of the 2008 crash.

Doomsaying is an industry unto itself so forgive me if I don’t pay attention to the people who predict gloom for a living. If you keep saying the same thing for long enough, eventually you will be right.

Personally, I would prefer to be right more often than ‘eventually.’

The Real Deal

Instead of blindly assuming that prices are going to come crashing down because they went up, lets look at where the market actually stands:

Building

  • Building starts are still well below what is required to keep pace with natural demand increases, much less the accrued backlog of undersupply. We are 3-5M homes undersupplied depending on which study you read.
  • In order to erase the 3-5M house deficit, we would have to double housing production for nearly a decade –– and have you seen the cost of lumber or the lead time on appliances?
  • Not only are we not building enough houses, we are also lagging well behind in lot development –– remember, you can’t build a home where there isn’t a lot.
  • The housing issues we are experiencing today did not begin with COVID, it began when the Great Recession decimated the construction industry beginning in 2006 –– and we have not recovered.
  • Furthermore, the issues facing the development industry are not easily fixed.
  • Affordable housing, or even housing that approaches median pricing, is impossible to build and thus the supply of housing below $500K is pretty much fixed.

Inventory

  • Large scale / institutional investors are purchasing up to 30% of the available houses in many markets, further suppressing supply.
  • Many builders are actually electing to build new homes for rent and keeping them versus selling them upon completion, meaning fewer new homes.
  • The average time in a home has nearly doubled from 7 to 13 years –– so supply side resales are not going to supply the market with the needed inventory.

Rents

  • Rents are up 15-30%, so not only is renting a poor financial alternative, renters are desperately trying to escape tenancy which drives up demand.
  • Vacancy in the rental sector is at an all time low, pushing up rents further.
  • Foreclosures just hit an all time low, despite the naysayer’s predictions otherwise.

Mortgage

  • Unlike 2008, there is little no risk from the mortgage market right now –– of the $8T in outstanding mortgagee debt, over 80% of it is financed at or below 4% and with a fixed rate.
  • Unlike 2008, the collective amount of homeowner equity in the US is 4-6X what it was in 2006.
  • Unlike 2008, subprime loans (a.k.a. ‘liar’ loans) are at most 1% of the mortgage market today –– in 2006 they comprised close to 40% of the market.
  • Rates rising doesn’t eliminate buyers, it just moves buyers down a notch in terms of affordability. Rising rates actually increase competition at the middle and lower price points, not decrease it. 
  • Substantially more cash is being used to purchase housing than in 2006-80, so rates increasing is not as impactful as it normally would be.
  • Just so you realize, from 1980 to 2000, the median house price tripled, despite mortgage rates no lower than 7% (and as high as 18%!)

Other Economic Factors

  • If someone’s analysis of the housing market doesn’t include the word ‘Millennial’ then they haven’t analyzed the demand side of the equation.
  • Gas prices are increasing the pressure on urban centers to provide more housing options –– which is precisely where adding inventory is the most difficult.
  • Inflation (which is good for real assets) is at generational highs.
  • If the housing market crashes, it will not be because of housing, but because of some other factor or cause that takes down all markets, not just housing. 

We’ve Never Been Here Before

No housing market has ever been exposed to the combination of factors that are in play today –– a rapidly expanded money supply, record setting inflation, disrupted supply chains, a pandemic, global unrest, a systemic lack of building, population growth, ‘Sun Belt-friendly’ migration patterns, and the decoupling of geography from employment (in other words, live where you want to and use Zoom.)

There is no precedent for this market so using using history as a guide is pointless.

Remember, market corrections occur when prices are overvalued, and not just because prices went up.

The bottom line is that if someone predicts a housing crash but doesn’t say why, when and/or by how much, then they should be ignored.

Millennials turning 34 + 5M homes undersupplied is driving today’s market –– and we can’t fix that overnight.

2022 Market Housing Market Forecast

January 14, 2022 By Rick Jarvis

Each year, we try to push out our thoughts about the housing market in the coming year.

2022 is no different.

The presentation we did this year we feel is one of the most important ones we have ever done.

Why?

Because the market conditions are quite frankly, unprecedented.

At no time in our history have we had so many extreme inputs to the market –– from inventory to stimulus to mortgage rates to inflation to migration –– everything.

To offer you a taste of what is in the presentation, here is a sample of what we see coming:

  • prices should continue to increase –– even possibly spike again
  • mortgage rates should rise
  • inventory conditions will continue to be near historic lows
  • migration to our region has never been higher
  • 2008 vs 2022 price analysis
  • new housing difficulties

And so much more…

Enjoy!

  • Go to page 1
  • Go to page 2
  • Go to page 3
  • Interim pages omitted …
  • Go to page 10
  • Go to Next Page »

Primary Sidebar

804.201.9683


How Do I Schedule a Showing or Find Out More?

I am Kendall C. Kendall, Client Care Coordinator for the team. I am a licensed Realtor and it is my job to answer questions and schedule showings for the properties shown on our sites. Here's our call policy.

kendall@richmondrelocation.net

Working With Buyers

I am Sarah Jarvis, Broker at One South and I work with our buyers. I bring 20+ years of experience to our Buyers Advocacy program and take great pride in helping our clients understand the RVA marketplace.

sarah@richmondrelocation.net

From the Blog

Our Algorithm

If you ask 10 Realtors what their job is, you will get at least 11 different answers. You would get answers like: 'We make dreams come true' 'We take the mystery out of buying or selling a home' 'We facilitate transactions' 'We market properties' While all of those answers are true …

[Read More...] about Our Algorithm

More Posts from this Category

  • Facebook
  • Instagram
  • LinkedIn
  • Twitter

The Ultimate Stats Page

Ultimate Stats Page

Latest Tweets

  • Just now

Footer 1

Test Text

804.201.9683


How Do I Schedule a Showing?

I am Kendall C. Kendall, Client Care Coordinator for the team. I am a licensed Realtor and it is my job to answer questions and schedule showings for the properties shown on our sites. Here's our call policy.
kendall@richmondrelocation.net

804.305.2344


How Do I Determine What I Can Afford?

We offer competitive mortgage solutions with a commitment to exceed your expectations. We’re local industry experts who are also your friends and neighbors. Whether you want to communicate online or in person, we’re just a call or click away.
www.cfmortgagecorp.com
C&F Logo

Equal Housing

The Sarah Jarvis Team agrees to provide equal professional service without regard to the race, color, religion, sex, handicap, familial status, national origin or sexual orientation of any prospective client, customer, or of the residents of any community. Any request from a home seller, landlord, or buyer to act in a discriminatory manner will not be fulfilled.

IDX Disclaimer

All of the information displayed here is deemed to be gathered from reliable sources but no warranties, either express of implied, are made part of this site. Additionally, the IDX Feed for listing information may contain descriptions of properties not represented by One South Realty, its agents or staff and any violations or misrepresentations are the sole responsibility of the listing brokerage of the subject property in violation.

Contact The Sarah Jarvis Team

804.201.9683

One South Square Logo

2314 West Main Street Richmond, VA 23220

sarah@richmondrelocation.net

Our Call Policy

Accessibility
Copyright

Lending

Southern Trust Mortgage Logo

Chris Lester
Senior Loan Administrator
NMLS# 353830
804-307-7033
Email Southern Trust Mortgage

Our Network of Sites: RichmondVaNewHomes.net, RichmondVaCondos.net, RichmondLuxuryNeighborhoods.com,
RichmondFanRealEstate.net, RichmondVaMLSSearch.net
Housekeeping: Sitemap, Listings Sitemap


Members of the Sarah Jarvis team are licensed in the Commonwealth of Virginia.


Loading Comments...