Euro-inspired Tudors.
Nouveau interpretations of traditional forms.
The new rise of Modernist architecture.
And, of course, a healthy dose of Richmond-centric designs in our most timeless neighborhoods.
It is the heyday of housing.
It Was the Best of Times …
Never before do I remember such a time.
When first licensed in the early 1990s, homebuilding was shifting. The transition from square brick and clapboard boxes of the 1960s and 1970s to the vinyl-clad ‘Transitionals’ was in full effect.
Open floor plans, two-story family rooms, and the luxury master bath all became the norm, in direct opposition to the boxy and formal residential architecture so prevalent in prior decades.
Then, for the better part of the next 15 years, we continued to build in this manner –– and we didn’t really deviate.
As a matter of fact, the only noticeable change we made in our construction from the late 1980s until the middle 2000s was to build increasingly larger homes on increasingly smaller lots … until … 2008 … and …. BOOM! And, well, we all remember what happened.
In the post-Great Recession recovery, housing styles changed yet again, and this time, I think we all recognize that the change is a good thing.
The Return to Authenticity in Architecture
Many moons ago, we wrote a blog called ‘A Return to Authenticity.’
The blog (written in 2011) discussed the tendency that during times of distress (and 2008 to 2011 definitely counts as distress), people tend to migrate back to the classic and the timeless. Looking at housing design in the post-recession years, you can see the trend for sure.
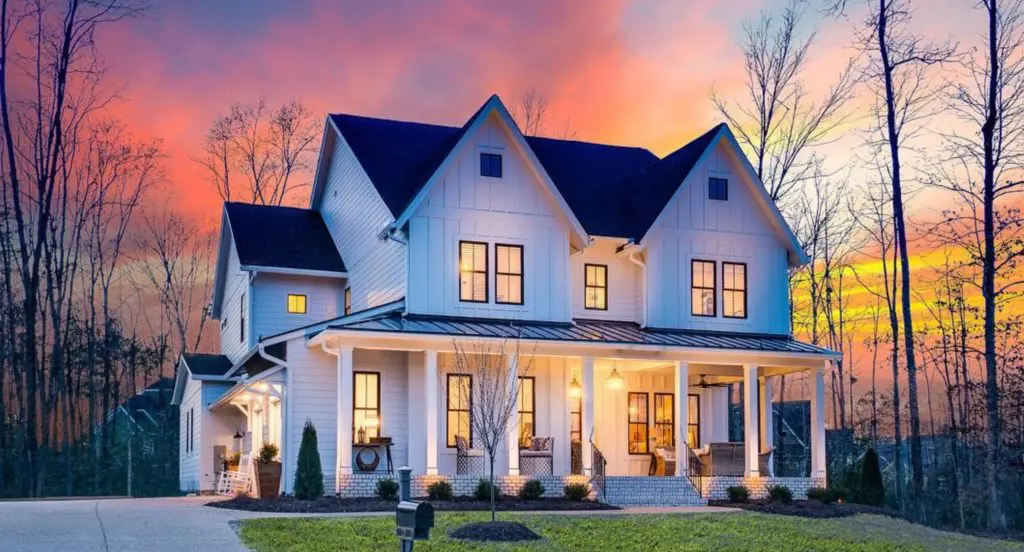
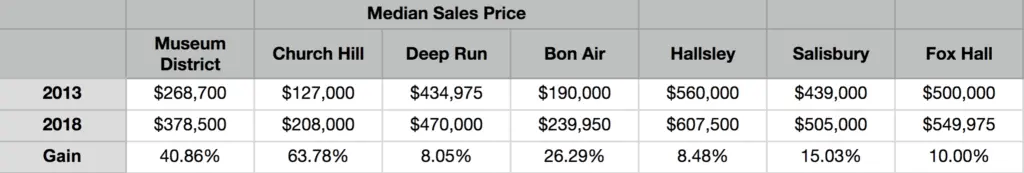
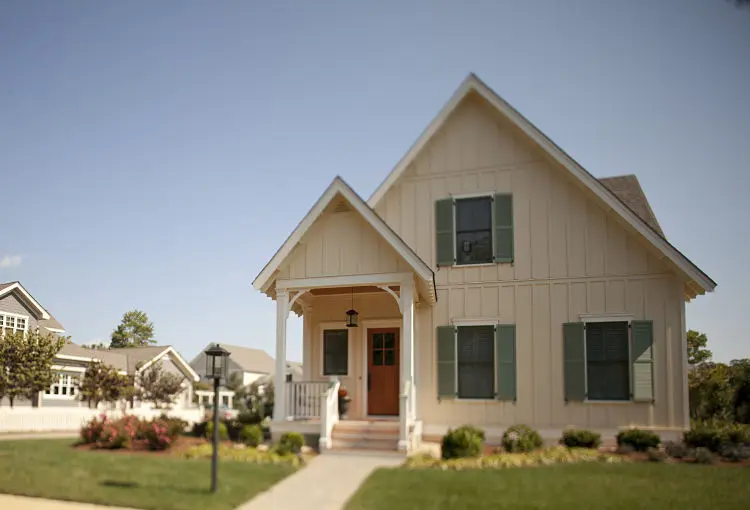
The re-emergence of Tudor, Craftsman, Four Square, and American Farmhouse styles is evident in almost all new neighborhoods and at all price points. Communities such as Hallsley have taken these designs to a new level with some truly extraordinary homes being constructed, especially in the more recent sections.
The bottom line is that developers (as well as county planners) are finally allowing more diversity in residential design which, in turn, is empowering a new crop of talented builders to flex their creative muscles. The results are far more interesting than the homogenous vinyl-clad and garage forward boxes of the pre-recession world.
Government Mandates and Building Codes
Over the past decade or so, the minimum standard for building homes has increased –– substantially.
More robust structural requirements, increased efficiencies in mechanical systems, heightened insulation standards, better electrical safety stops, more durable materials –– all of these have led to better built, safer, stronger, more energy efficient and longer lasting homes than their predecessors. And (for the most part) that is a good thing.
But, what happens when you increase mandates and minimum standards? You increase expenses.
All of these escalating requirements have made it increasingly difficult to bring affordable housing to the market. While there is no doubt that the average new home is far superior to the new home of yesteryear, it is also far more expensive to build, and it is raising the threshold for entry into homeownership … but perhaps that is another post for another day.
Infill. Adaptive Re-use. Renovation. Addition.
In addition to the renaissance in suburban new construction, a noticeable transformation in the mature urban areas is in full force as well.
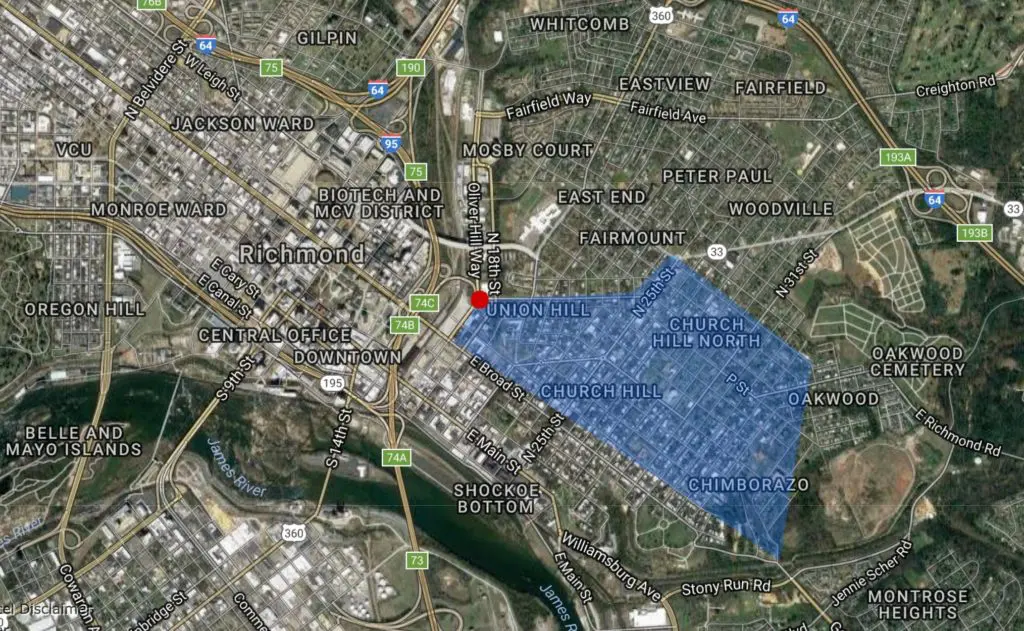
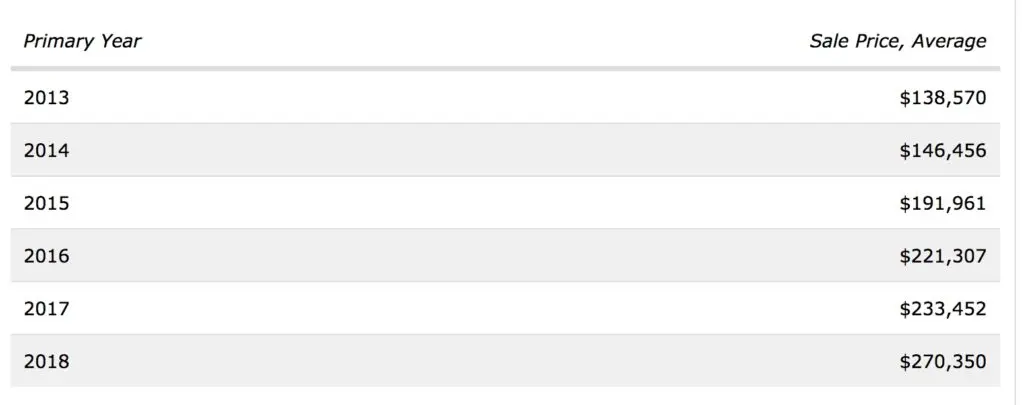
As the city of Richmond continues to reverse the decades-old trend of population decline, the number of people who are moving into the city has never been higher. When demand is increasing and supply is fixed, prices rise –– and never has it been in more evident than in the more affordable sections of Richmond.
North Church Hill, Highland Park, Brookland Park, and Barton Heights have seen median prices increase by as much as 300% in the last decade. Why? It is all about demand.
How to best solve the issue? Urban infill/adaptive re-use, full-scale renovation, and addition are how.
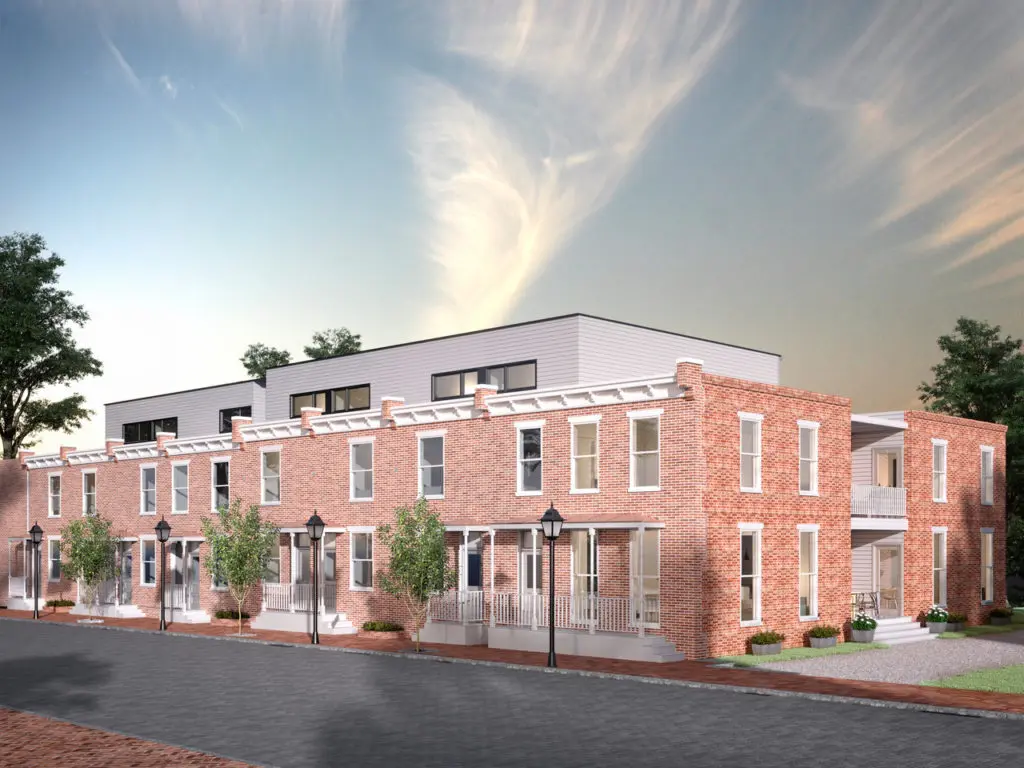
- Projects such as 7 West, Huntt’s Row, Jefferson Green, the Meridian, and Citizen 6 are examples of adaptive re-use and/or infill.
- Numerous homes in urban communities have undergone total renovations in order to revive their contribution to the community.
- Many current owners are electing to simply add on to their existing homes in lieu of incurring the cost of moving.
At the end of the day, the housing stock in the urban core is in demand like never before … and the building community has taken notice.
The Luxury Townhome
Another interesting development for Richmond is the emergence of luxury townhomes.
For years, the townhome was considered an affordable alternative to the single-family detached home –– a sort of starter home if you will. Townhomes were definitely not considered an option for the empty-nesting downsizing buyer –– and absolutely not in suburbia.
West Broad Village and GreenGate changed everyone’s opinion.
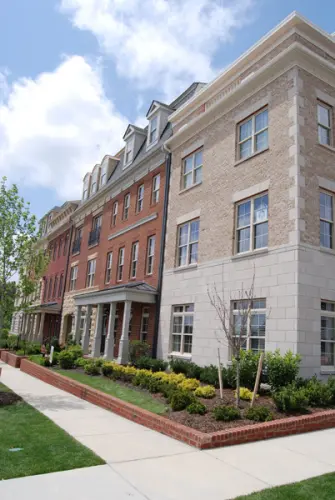
The upscale and luxury suburban townhome has sold incredibly well when placed in the ‘new urbanist’ mixed-use developments of Western Henrico. The ability to sell one’s 5 bedroom, maintenance intensive, 30-year-old colonial and move into a luxury ‘town’ that is walkable to high-end grocers, green spaces, restaurants, and other supporting retail is appealing to many –– especially when a residential elevator can minimize the annoyance of stairs.
So for many, the new version of ‘Downsizing’ refers more to the downsizing of maintenance responsibilities than downsizing the actual size (and price) of the home.
Expect to continue to see more and more of our housing market dedicated to the construction of upscale and luxury townhomes in areas that had traditionally been the bastion of detached single-family housing.
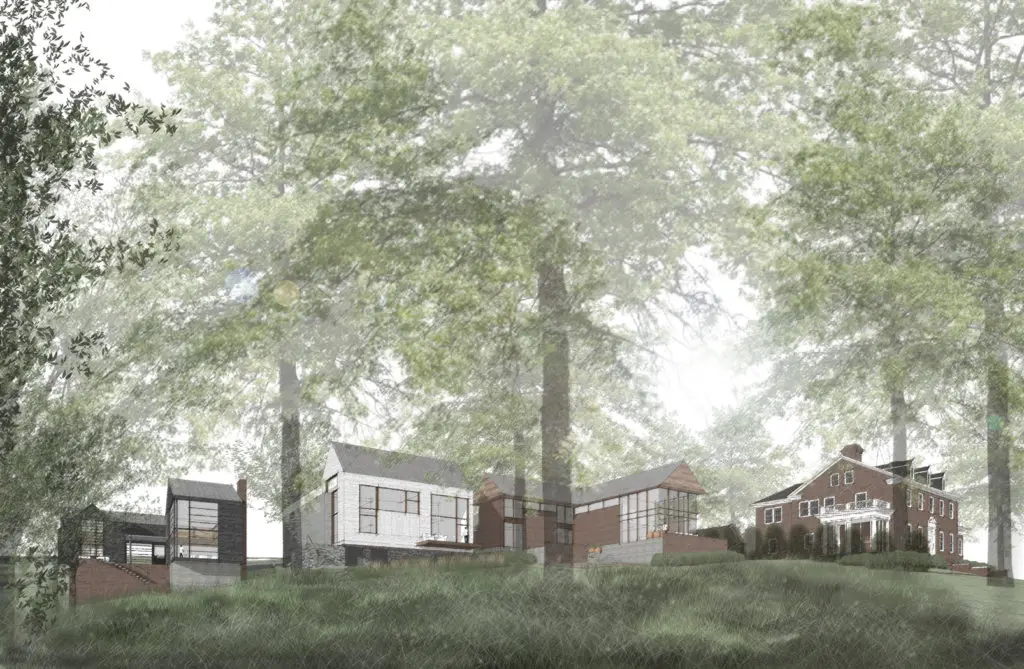
An Acceptance of Modernism
7 West, Citizen 6, the new modern section being built in Rountrey, South Bank Ridge (coming soon!) and the spectacular modern home being built 5404 New Kent Ave –– all of these are examples of residential architectural design that 10 years ago would have been shunned by a traditional Richmonder.
No more.
The appreciation for modern architecture has never been higher and the quality of architect who can truly design these types of homes has never been better.
The recognition of and appreciation for the modernist movement has actually led to the immensely popular Modern Richmond tour AND the imminent publication of a book detailing the history of Modern Richmond tours.
What We Didn’t Talk About …
This post could have been far longer.
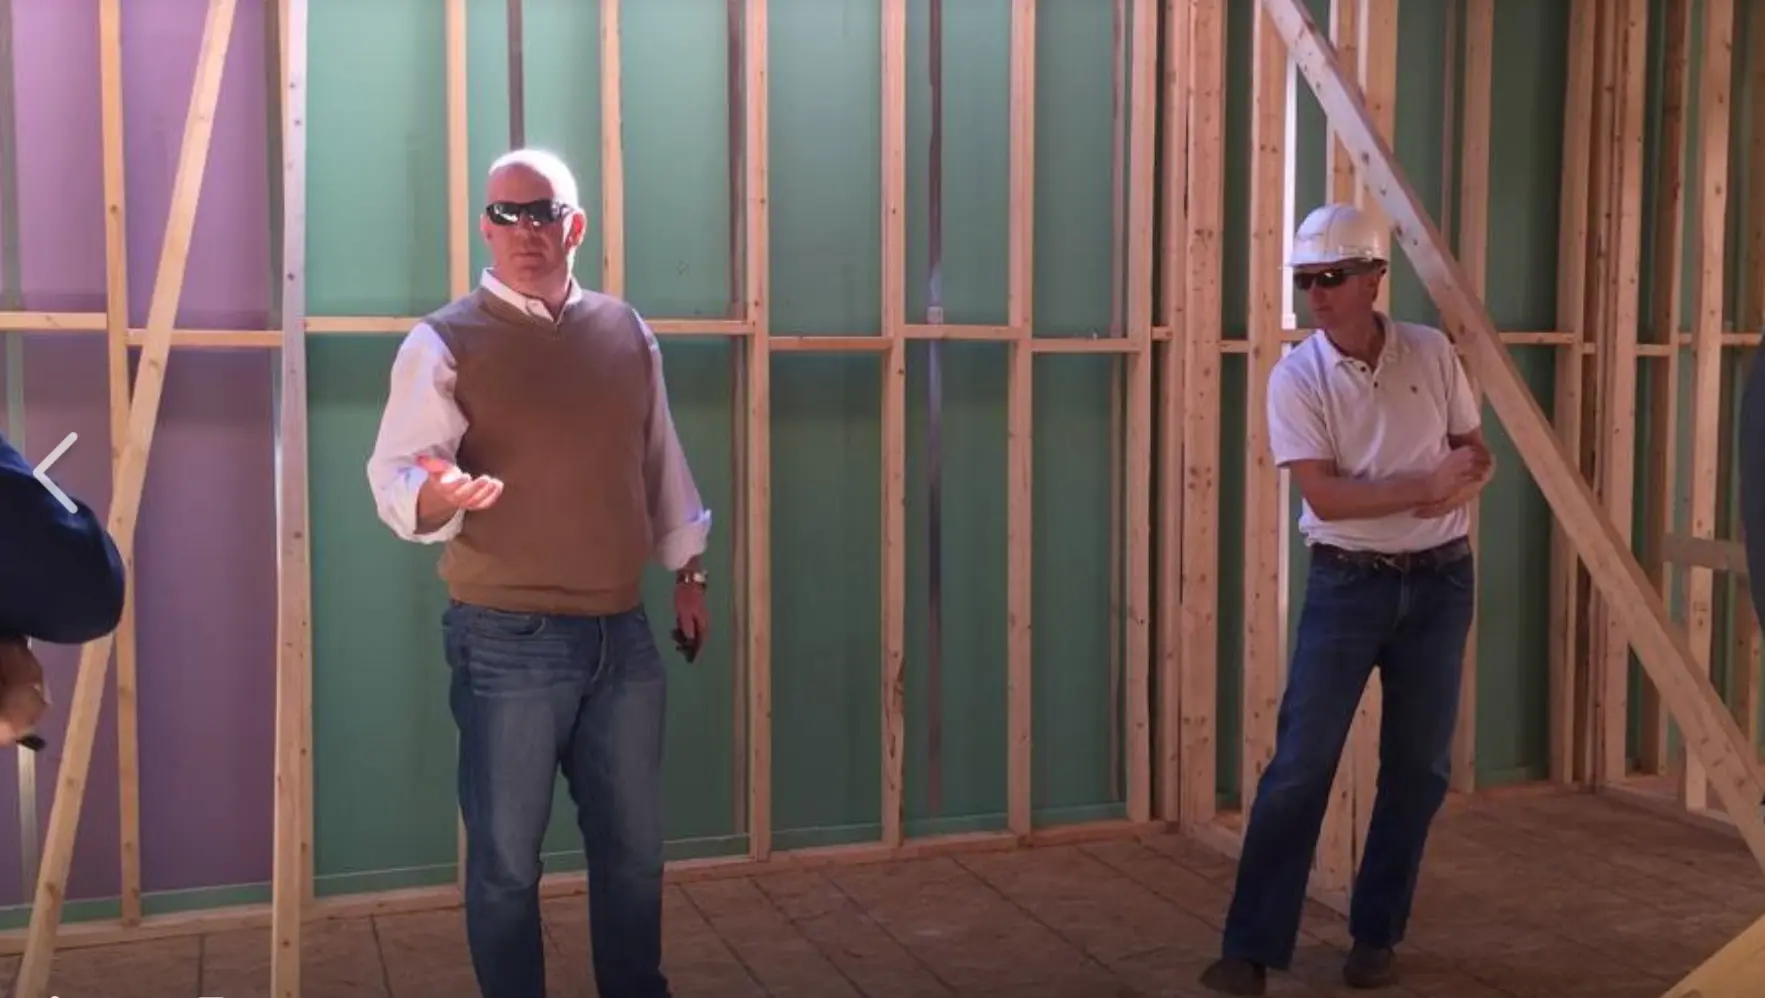
We didn’t touch on the new technologies that builders are using to not only help them design housing, but to test it, refine it, and engineer out the inefficiencies.
We also didn’t touch on the consumer experience, which has improved by leaps and bounds in the past decade. Every successful builder knows that the internet gives the disgruntled consumer a voice and the ability to punish transgressions unmercifully.
Simply put, the region’s best builders recognize that building a great home isn’t enough anymore, they also need to provide an interactive, participatory, and transparent process to ensure the consumer’s experience is a positive one.
Summary
At the end of the day, we are in a great era for housing. Housing today has better bones, better materials, better equipment, and is better architected than in days past –– there is no debate.
That said, building is not just a job, it is a responsibility to the future of Richmond, and more than ever before, the building community recognizes that fact. I believe that when we look back in 50 years, we will look back with a fondness for the quality, design, and diversity of what was being built today.